Commodity facts
A new fact every day about where commodities come from and what they cost. There are 370 of them, and every one is computed from the data behind this site: the number, the year and the source come from the same tables as the commodity pages, so none is typed in by hand.
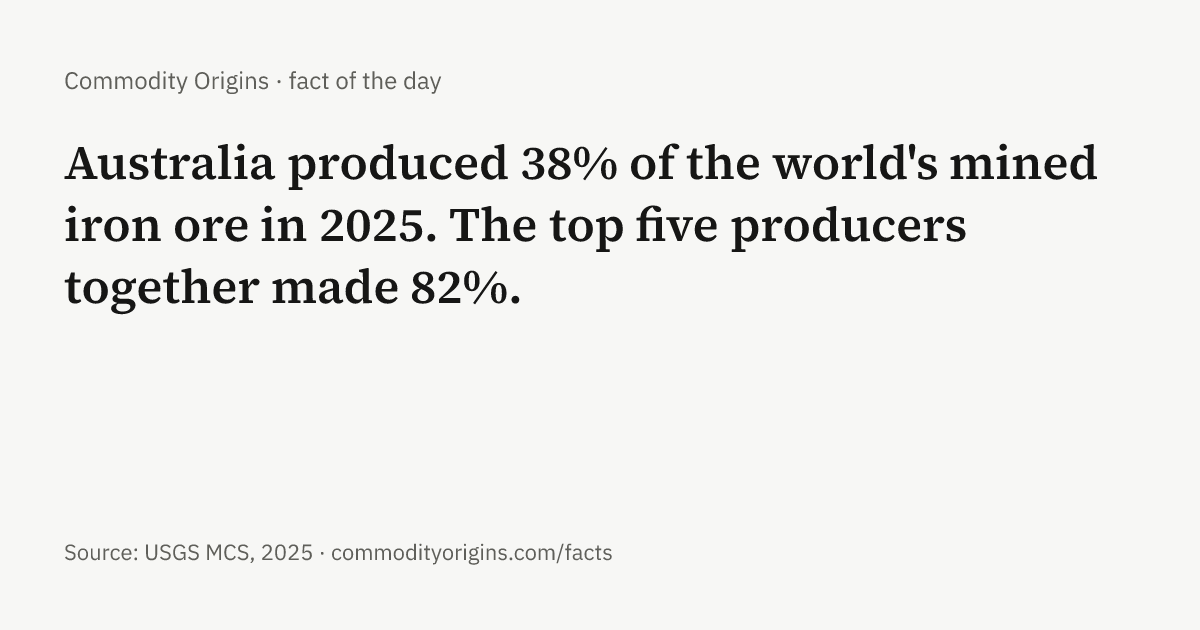
Australia produced 38% of the world's mined iron ore in 2025. The top five producers together made 82%.
Source: USGS MCS, 2025
The last seven days
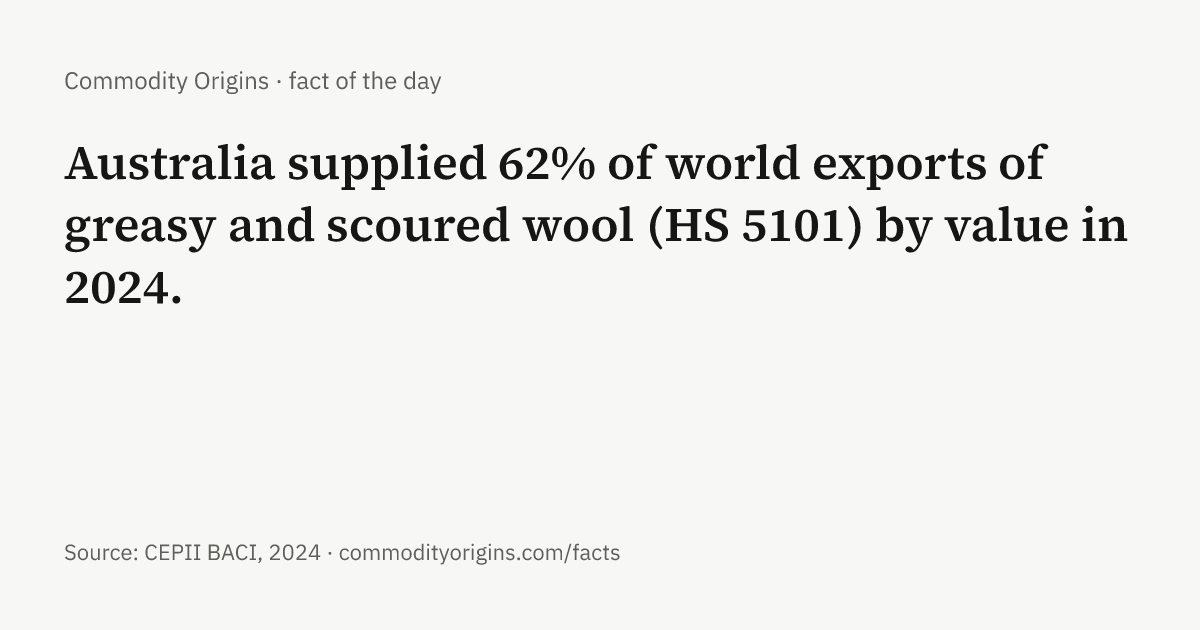
Australia supplied 62% of world exports of greasy and scoured wool (HS 5101) by value in 2024. (CEPII BACI, 2024)
At 2025 mining rates, the world's known bauxite reserves would last about 66 years. That is a snapshot, not a forecast: reserves are re-estimated as prices change and new deposits are found. (USGS MCS, 2025)
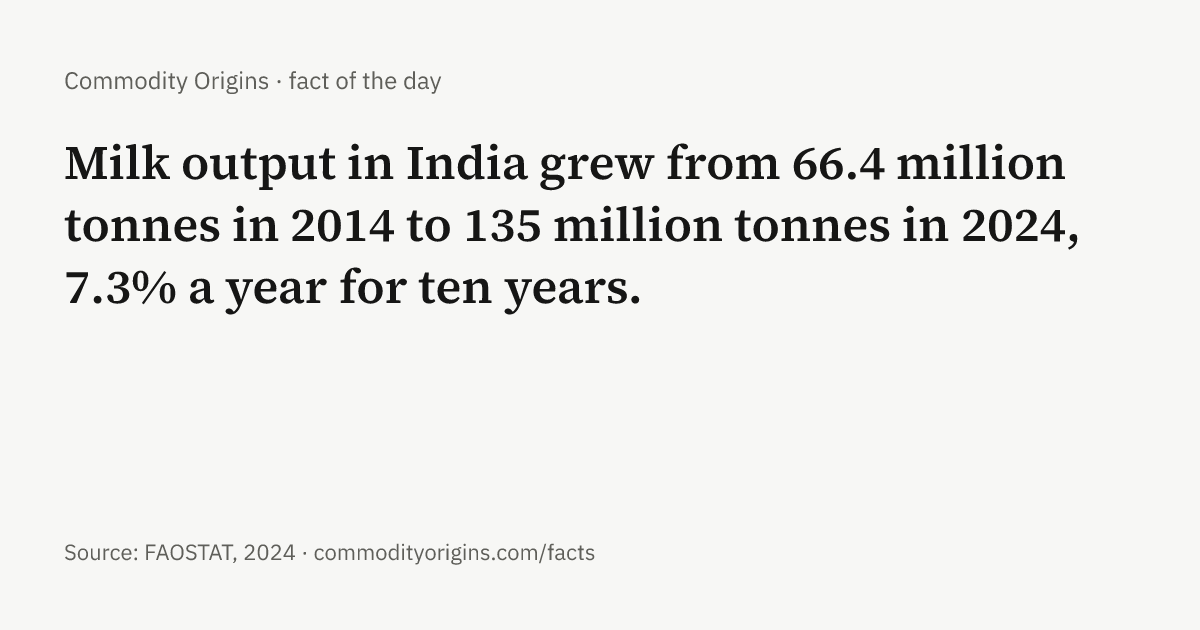
Milk output in India grew from 66.4 million tonnes in 2014 to 135 million tonnes in 2024, 7.3% a year for ten years. (FAOSTAT, 2024)
Adjusted for US inflation, phosphate rock costs about 21% of what it did at its February 1977 peak (the World Bank series starts in 1960). (World Bank Pink Sheet, 2026)
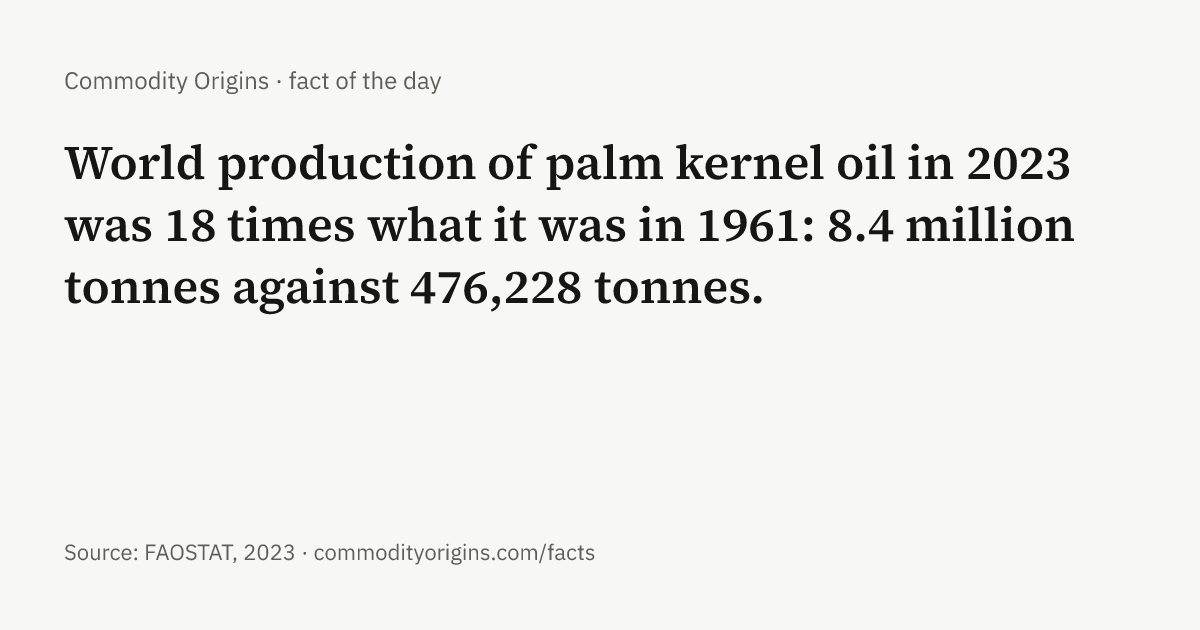
World production of palm kernel oil in 2023 was 18 times what it was in 1961: 8.4 million tonnes against 476,228 tonnes. (FAOSTAT, 2023)
China is the world's largest producer of primary aluminum (61% of output in 2025), but Canada is the largest exporter of unwrought aluminum (HS 7601) (10% of world export value in 2024). China is outside the top 15 exporters. (CEPII BACI, 2024)
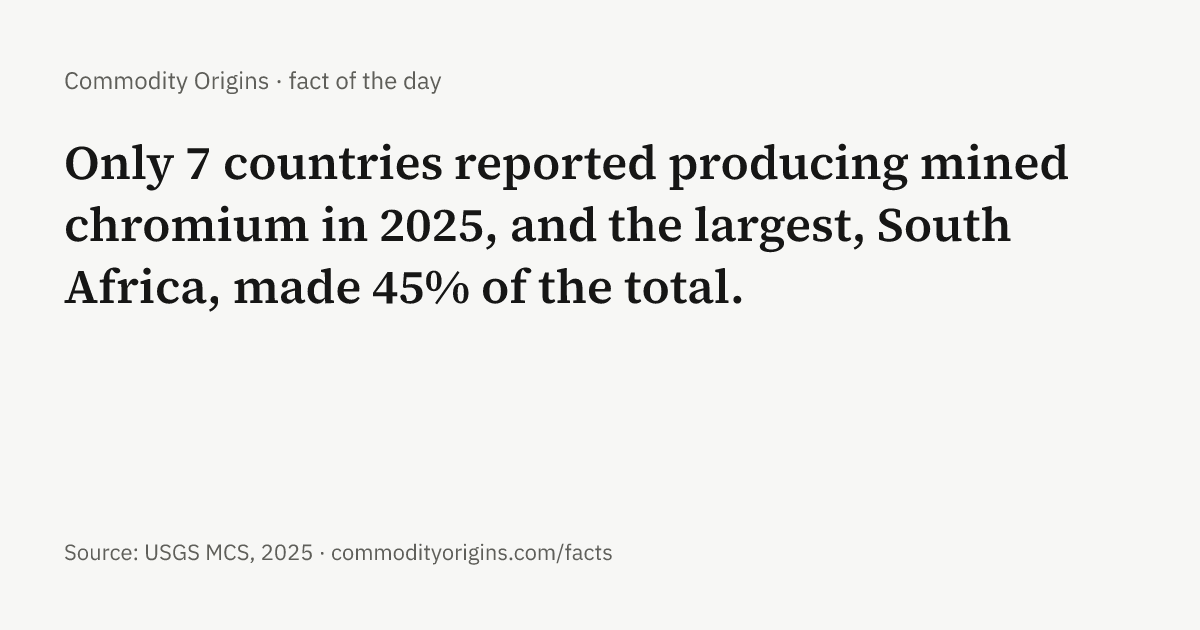
Only 7 countries reported producing mined chromium in 2025, and the largest, South Africa, made 45% of the total. (USGS MCS, 2025)
All 370 facts
Who makes it
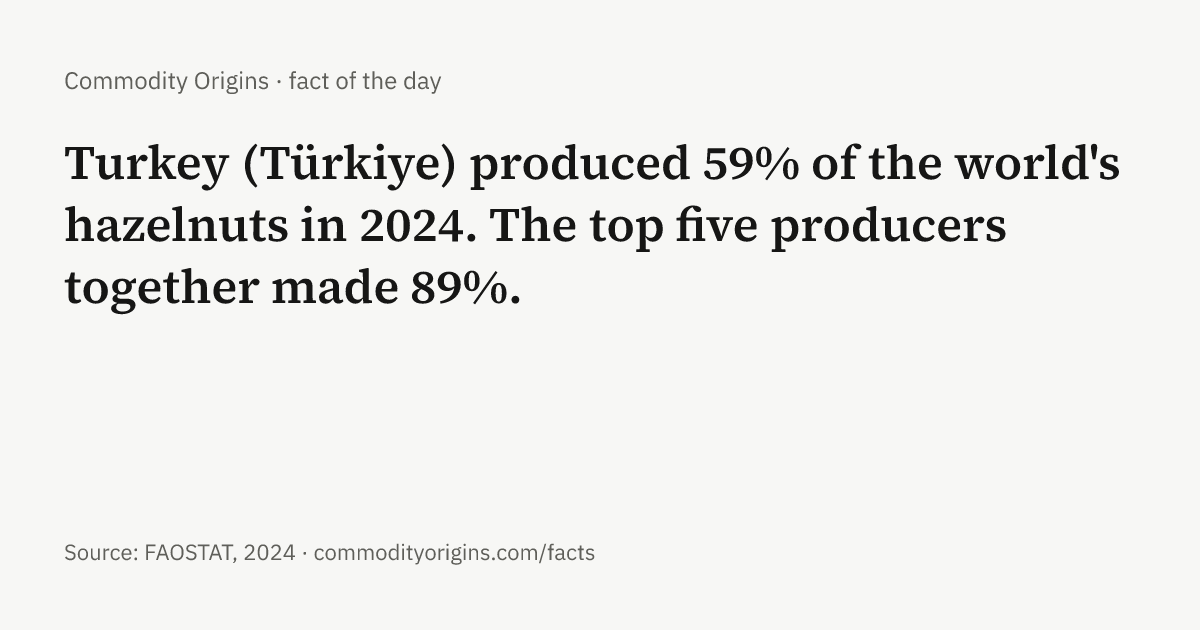
- Turkey (Türkiye) produced 59% of the world's hazelnuts in 2024. The top five producers together made 89%. Source: FAOSTAT, 2024. Hazelnuts · Turkey (Türkiye) · # · image
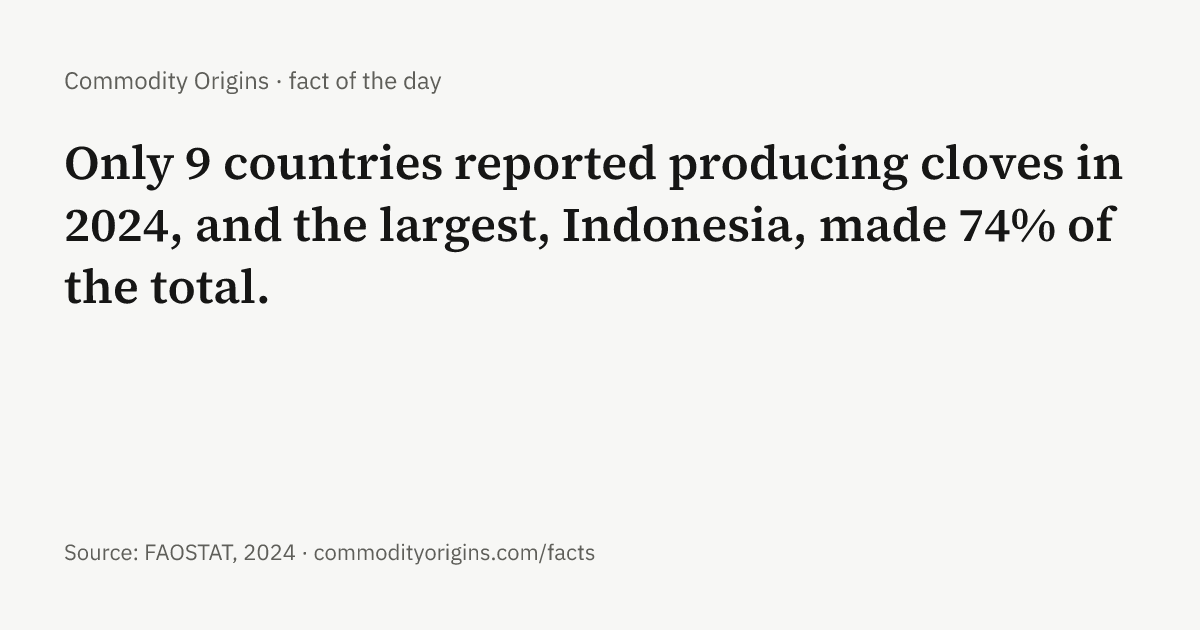
- Only 9 countries reported producing cloves in 2024, and the largest, Indonesia, made 74% of the total. Source: FAOSTAT, 2024. Cloves · Indonesia · # · image
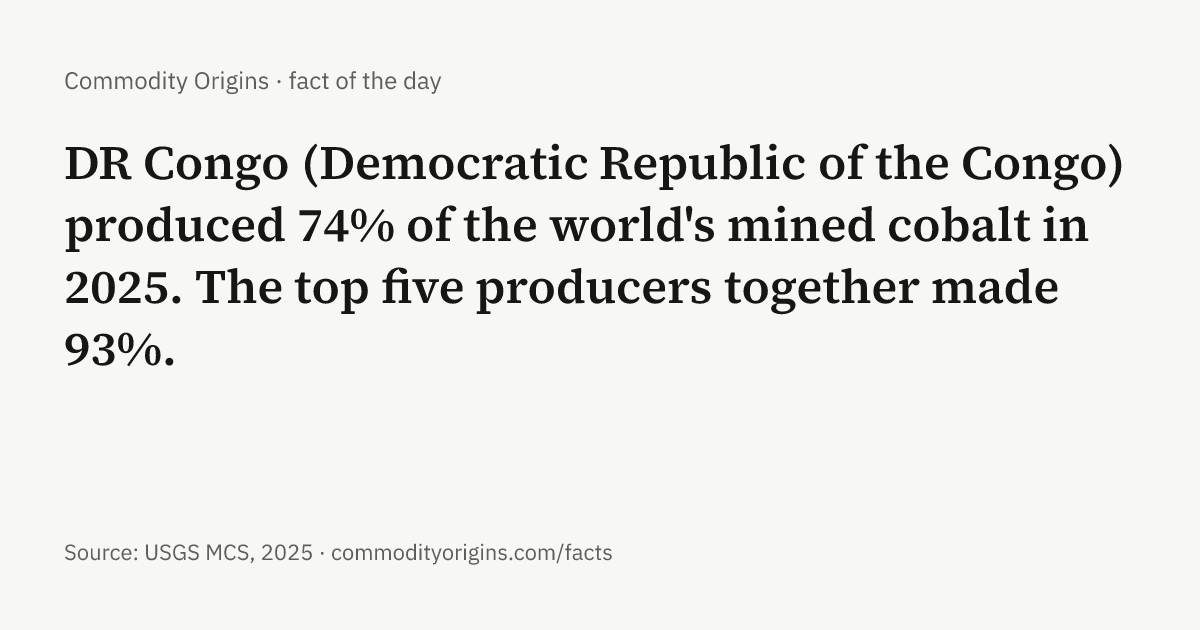
- DR Congo (Democratic Republic of the Congo) produced 74% of the world's mined cobalt in 2025. The top five producers together made 93%. Source: USGS MCS, 2025. Cobalt · DR Congo (Democratic Republic of the Congo) · # · image
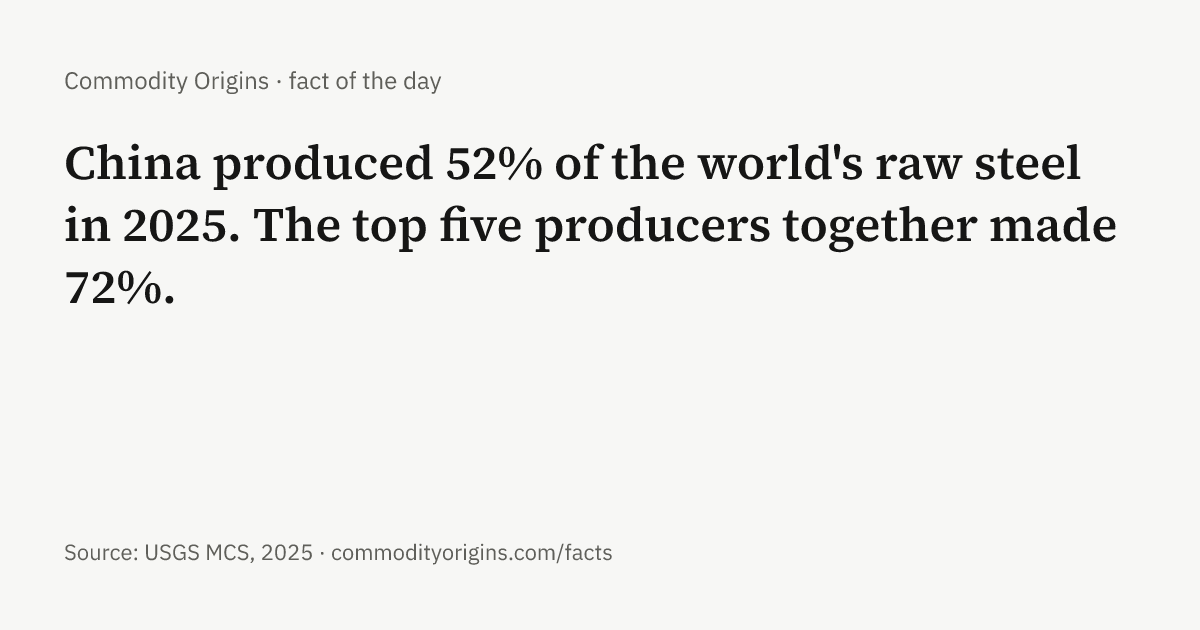
- China produced 52% of the world's raw steel in 2025. The top five producers together made 72%. Source: USGS MCS, 2025. Steel · China · # · image
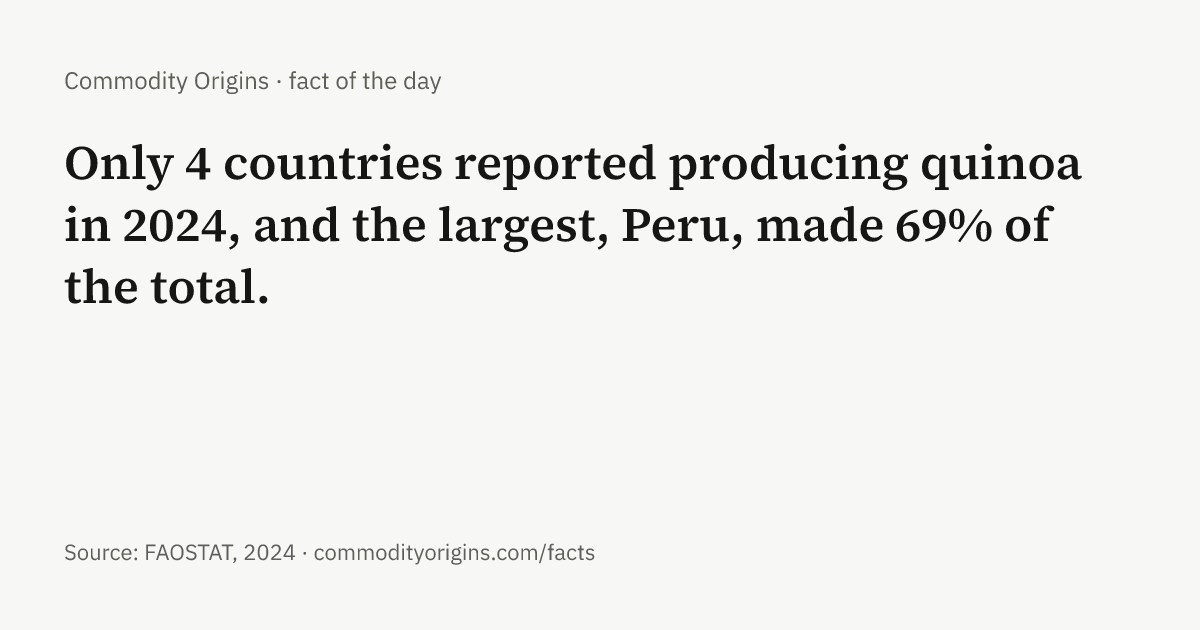
- Only 4 countries reported producing quinoa in 2024, and the largest, Peru, made 69% of the total. Source: FAOSTAT, 2024. Quinoa · Peru · # · image
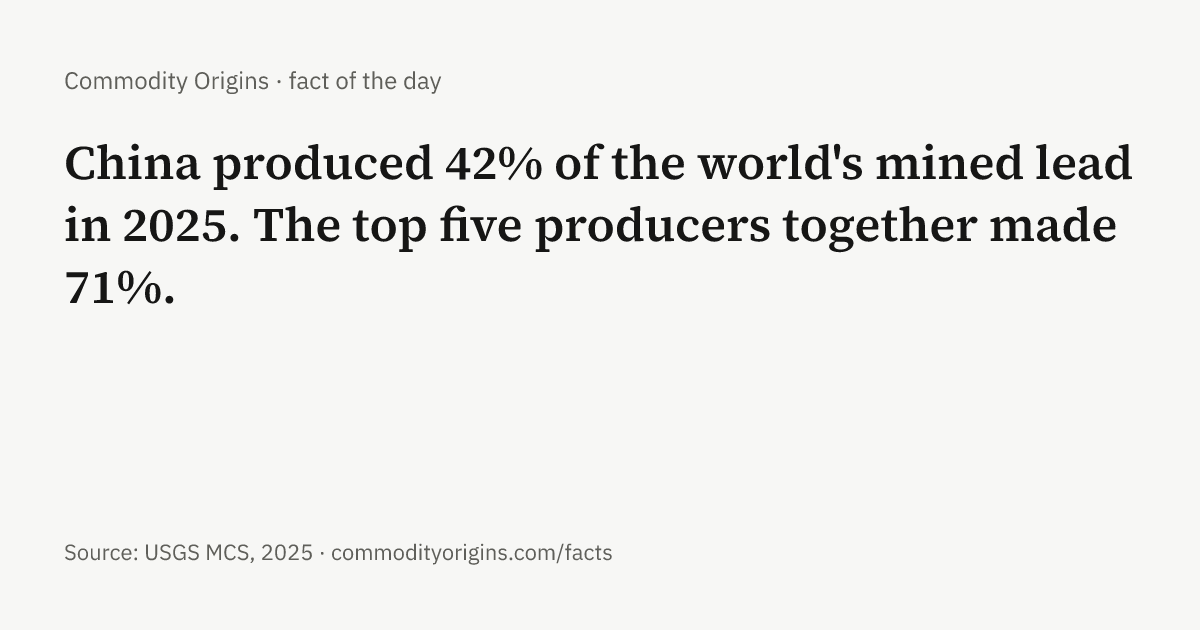
- China produced 42% of the world's mined lead in 2025. The top five producers together made 71%. Source: USGS MCS, 2025. Lead · China · # · image
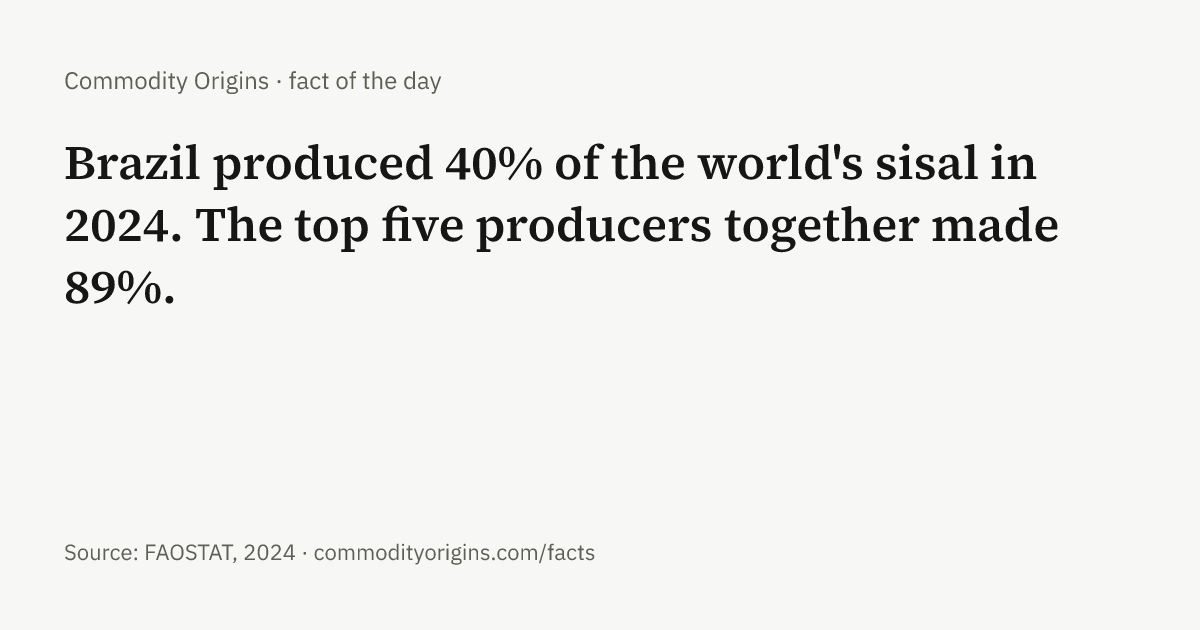
- Brazil produced 40% of the world's sisal in 2024. The top five producers together made 89%. Source: FAOSTAT, 2024. Sisal · Brazil · # · image
- The United States produced 51% of the world's almonds in 2024. The top five producers together made 79%. Source: FAOSTAT, 2024. Almonds · United States · # · image
- Indonesia produced 59% of the world's palm oil in 2023. The top five producers together made 91%. Source: FAOSTAT, 2023. Palm oil · Indonesia · # · image
- The United States produced 36% of the world's pistachios in 2024. The top five producers together made 99%. Source: FAOSTAT, 2024. Pistachios · United States · # · image
- China produced 53% of the world's plywood in 2024. The top five producers together made 79%. Source: FAOSTAT forestry, 2024. Plywood · China · # · image
- Indonesia produced 74% of the world's cloves in 2024. The top five producers together made 98%. Source: FAOSTAT, 2024. Cloves · Indonesia · # · image
- Indonesia produced 59% of the world's palm kernel oil in 2023. The top five producers together made 92%. Source: FAOSTAT, 2023. Palm kernel oil · Indonesia · # · image
- China produced 52% of the world's apples in 2024. The top five producers together made 68%. Source: FAOSTAT, 2024. Apples · China · # · image
- Indonesia produced 67% of the world's mined nickel in 2025. The top five producers together made 86%. Source: USGS MCS, 2025. Nickel · Indonesia · # · image
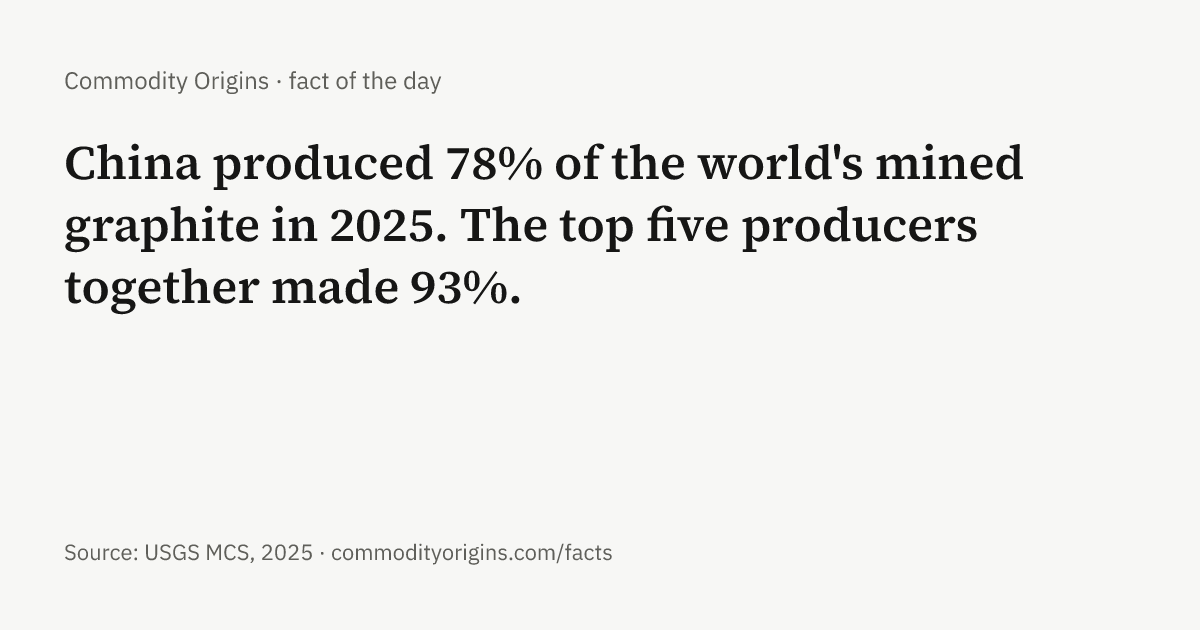
- China produced 78% of the world's mined graphite in 2025. The top five producers together made 93%. Source: USGS MCS, 2025. Graphite · China · # · image
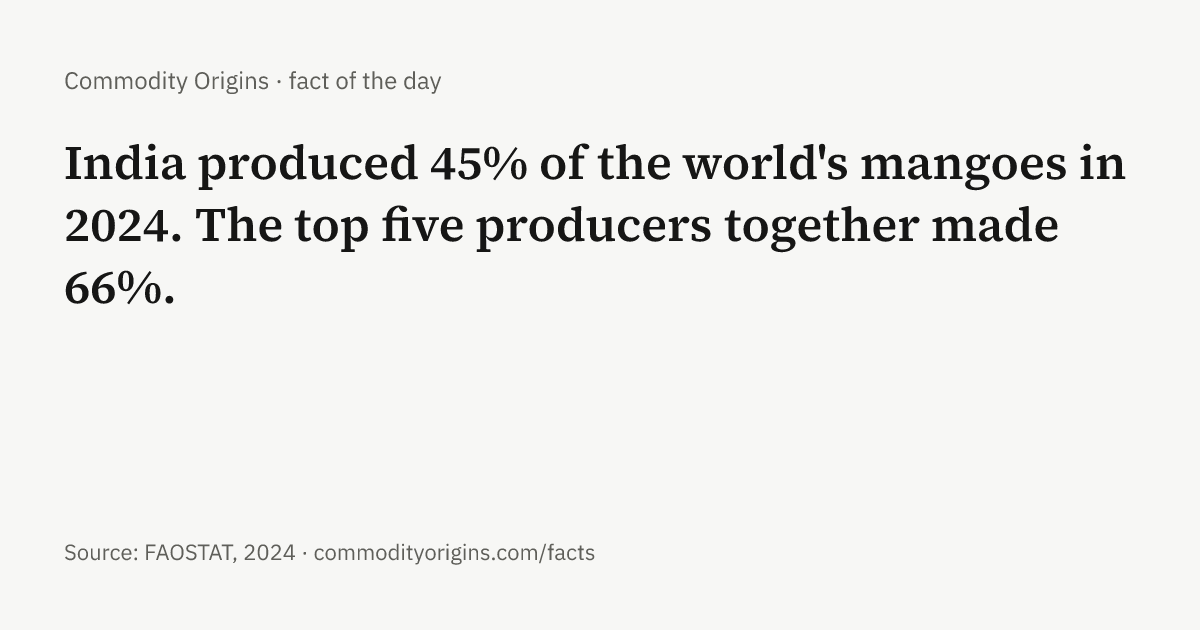
- India produced 45% of the world's mangoes in 2024. The top five producers together made 66%. Source: FAOSTAT, 2024. Mangoes · India · # · image
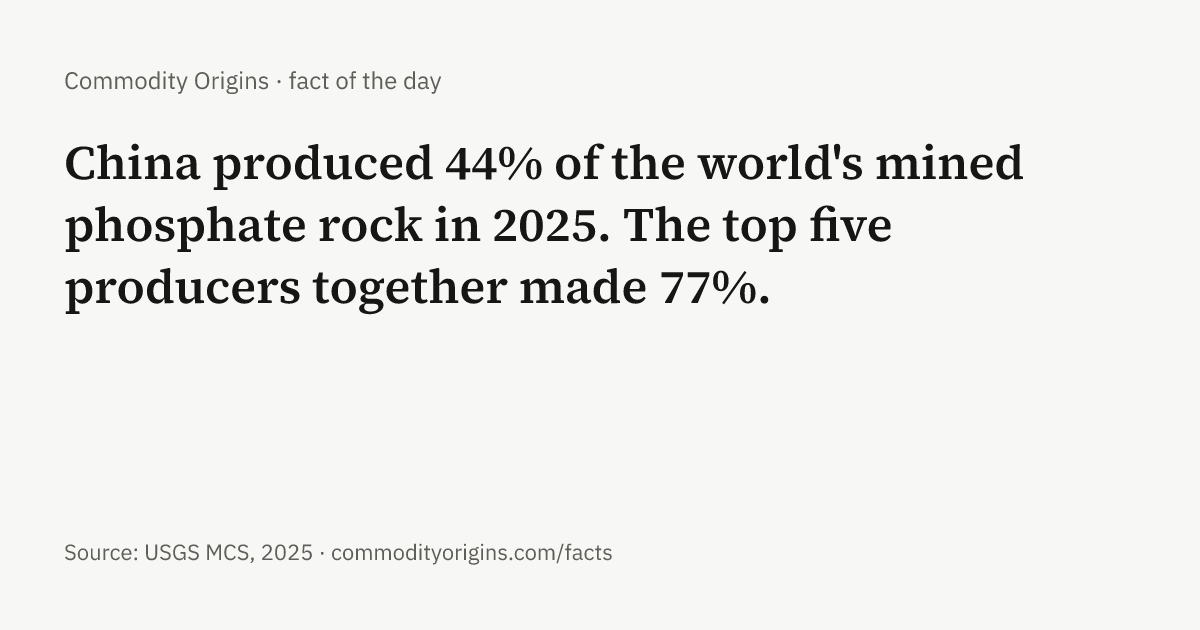
- China produced 44% of the world's mined phosphate rock in 2025. The top five producers together made 77%. Source: USGS MCS, 2025. Phosphate rock · China · # · image
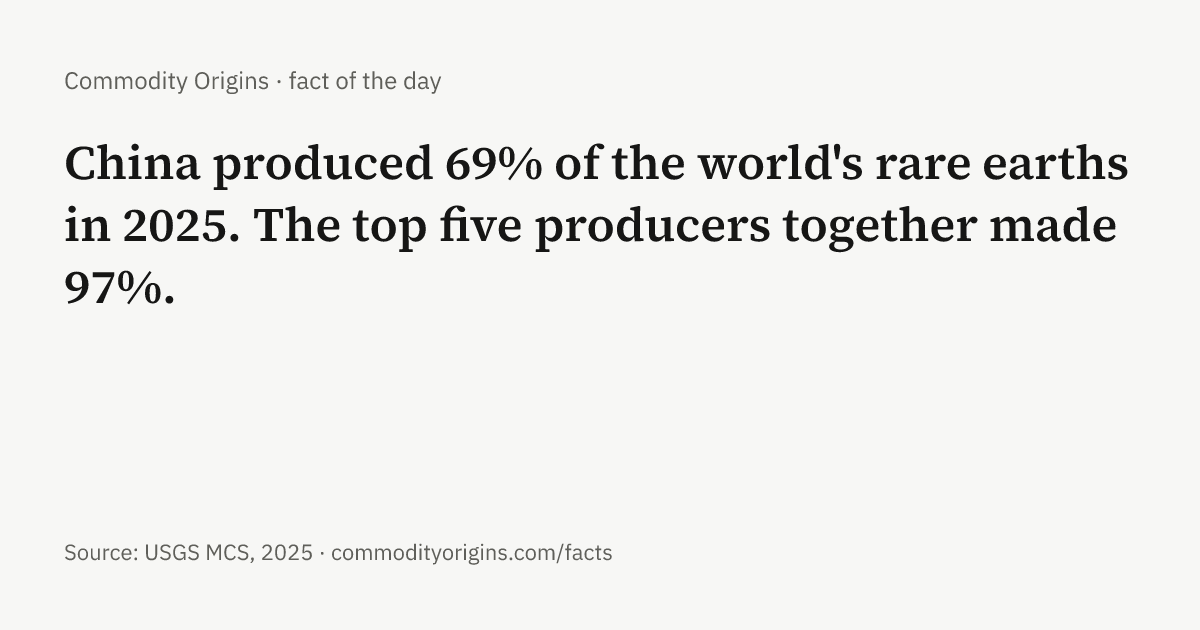
- China produced 69% of the world's rare earths in 2025. The top five producers together made 97%. Source: USGS MCS, 2025. Rare earths · China · # · image
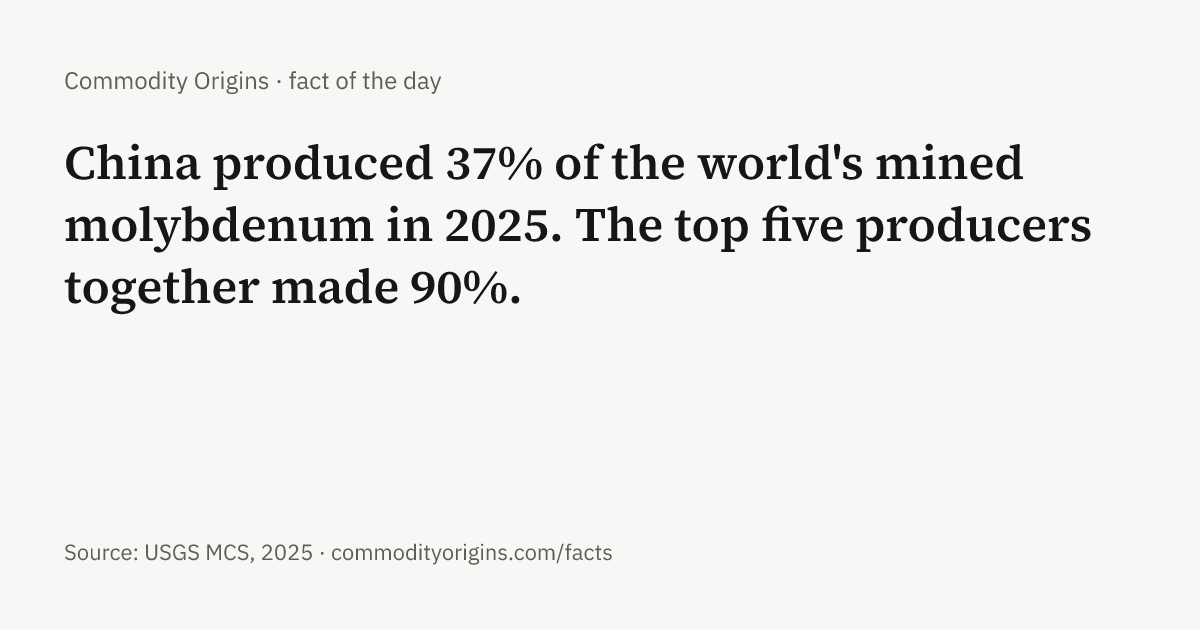
- China produced 37% of the world's mined molybdenum in 2025. The top five producers together made 90%. Source: USGS MCS, 2025. Molybdenum · China · # · image
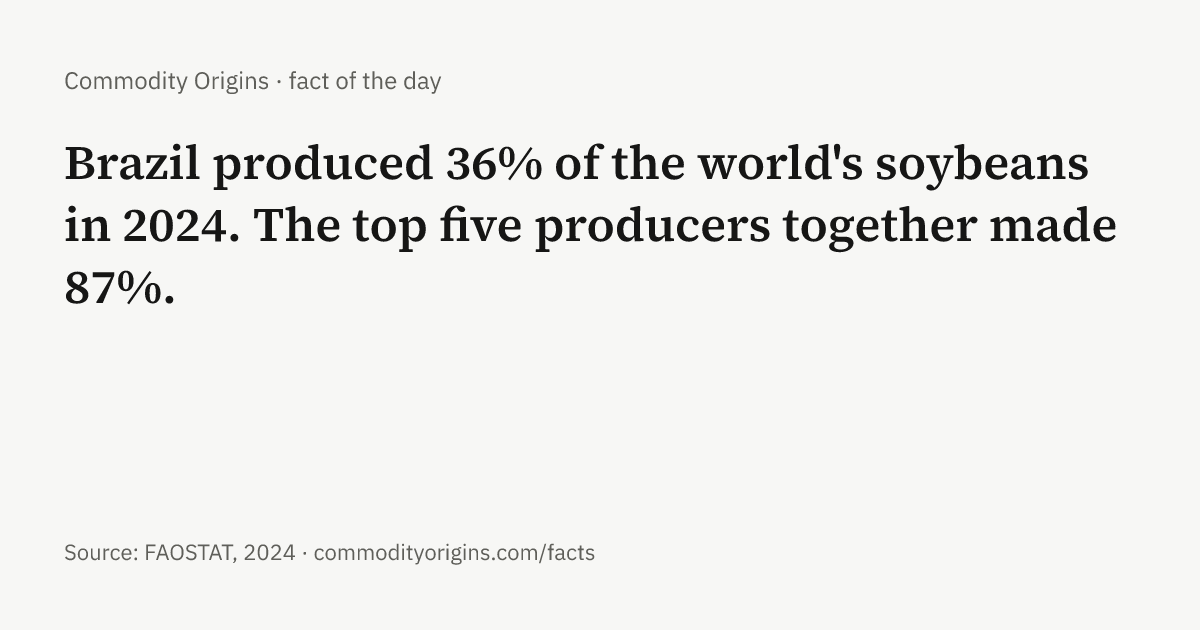
- Brazil produced 36% of the world's soybeans in 2024. The top five producers together made 87%. Source: FAOSTAT, 2024. Soybeans · Brazil · # · image
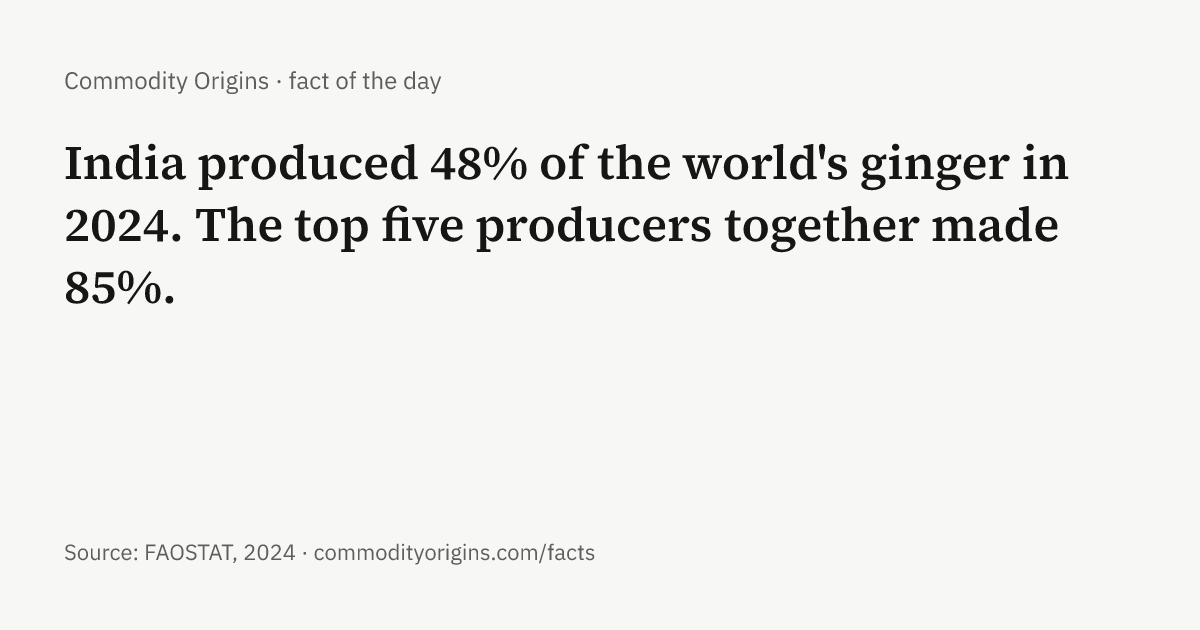
- India produced 48% of the world's ginger in 2024. The top five producers together made 85%. Source: FAOSTAT, 2024. Ginger · India · # · image
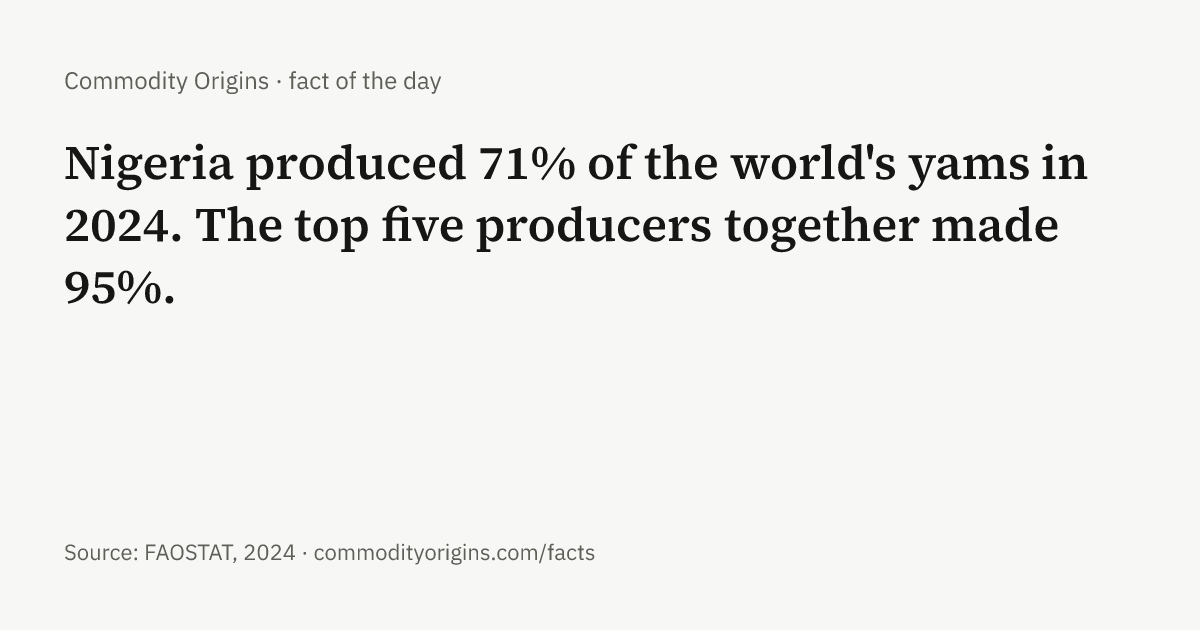
- Nigeria produced 71% of the world's yams in 2024. The top five producers together made 95%. Source: FAOSTAT, 2024. Yams · Nigeria · # · image
- Peru produced 69% of the world's quinoa in 2024. The top five producers together made 100%. Source: FAOSTAT, 2024. Quinoa · Peru · # · image
- China produced 37% of the world's tobacco in 2024. The top five producers together made 70%. Source: FAOSTAT, 2024. Tobacco · China · # · image
- Russia produced 44% of the world's mined palladium in 2025. The top five producers together made 100%. Source: USGS MCS, 2025. Palladium · Russia · # · image
- India produced 56% of the world's silk cocoons in 2024. The top five producers together made 98%. Source: FAOSTAT, 2024. Silk · India · # · image
- Ivory Coast (Côte d'Ivoire) produced 36% of the world's cocoa in 2024. The top five producers together made 73%. Source: FAOSTAT, 2024. Cocoa · Ivory Coast (Côte d'Ivoire) · # · image
- Five countries (the United States, Turkey (Türkiye), Iran, Syria, China) produced 99% of the world's pistachios in 2024. Source: FAOSTAT, 2024. Pistachios · # · image
- China produced 46% of the world's pork in 2024. The top five producers together made 68%. Source: FAOSTAT, 2024. Pork · China · # · image
- Only 8 countries reported producing mined manganese in 2025, and the largest, South Africa, made 38% of the total. Source: USGS MCS, 2025. Manganese · South Africa · # · image
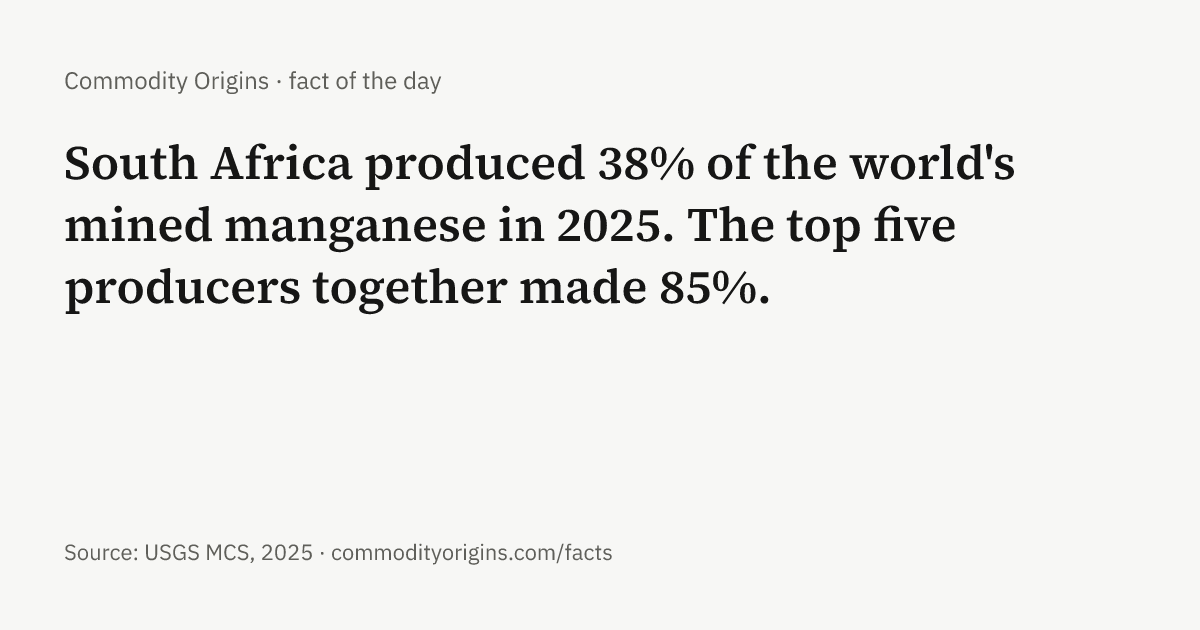
- South Africa produced 38% of the world's mined manganese in 2025. The top five producers together made 85%. Source: USGS MCS, 2025. Manganese · South Africa · # · image
- Only 7 countries reported producing mined chromium in 2025, and the largest, South Africa, made 45% of the total. Source: USGS MCS, 2025. Chromium · South Africa · # · image
- Australia produced 38% of the world's mined iron ore in 2025. The top five producers together made 82%. Source: USGS MCS, 2025. Iron ore · Australia · # · image
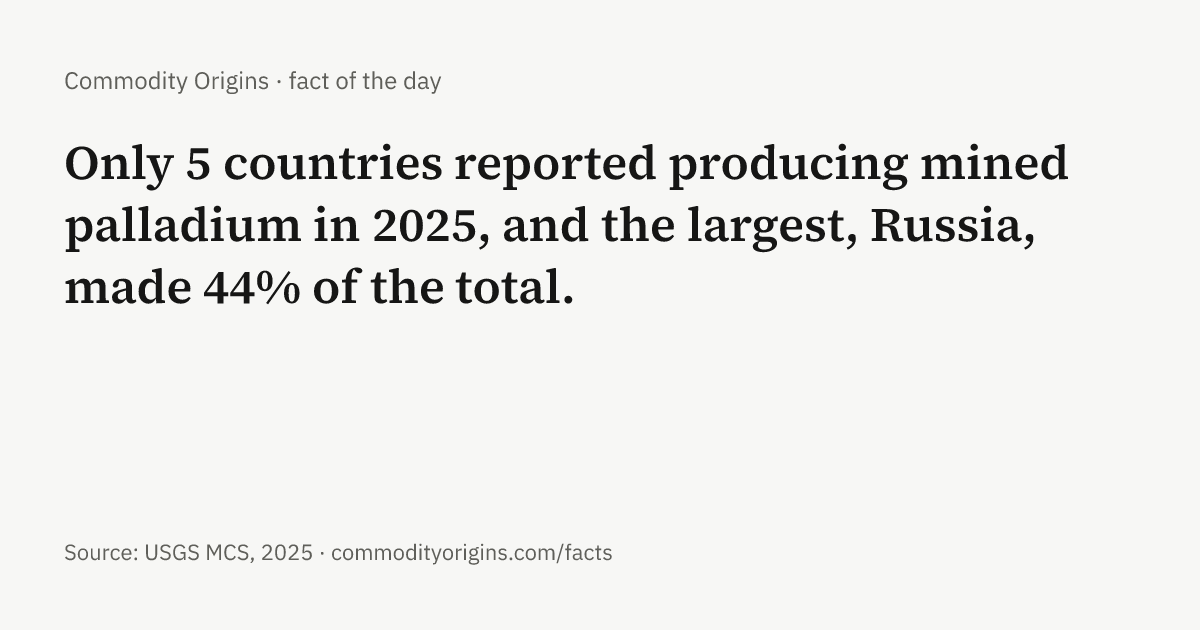
- Only 5 countries reported producing mined palladium in 2025, and the largest, Russia, made 44% of the total. Source: USGS MCS, 2025. Palladium · Russia · # · image
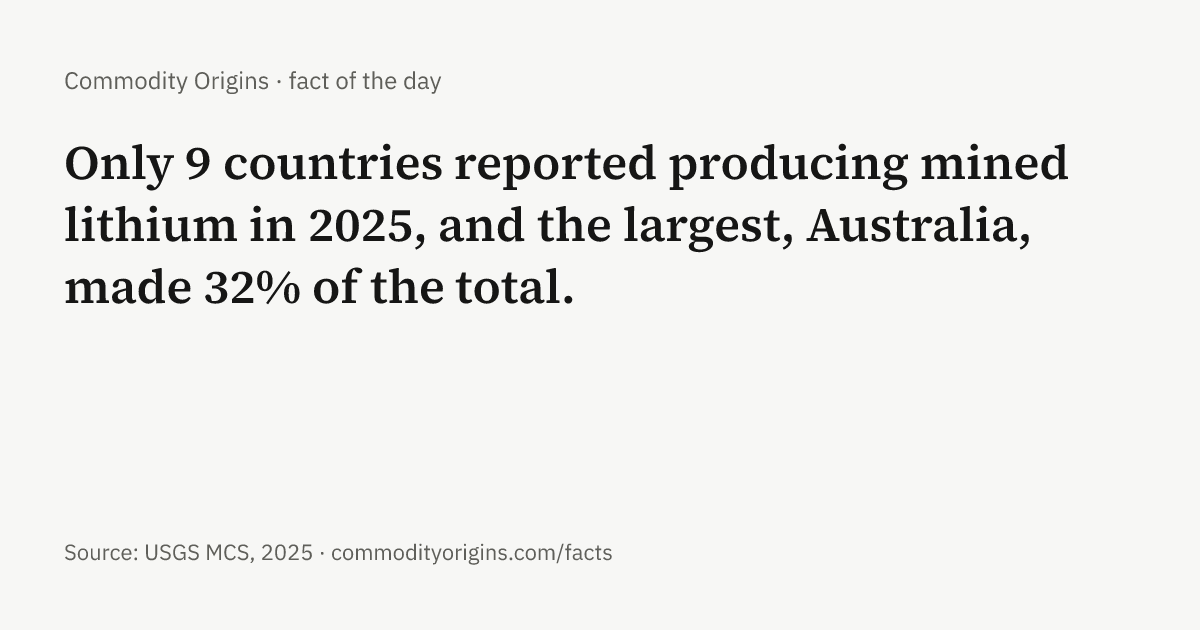
- Only 9 countries reported producing mined lithium in 2025, and the largest, Australia, made 32% of the total. Source: USGS MCS, 2025. Lithium · Australia · # · image
- China produced 61% of the world's primary aluminum in 2025. The top five producers together made 80%. Source: USGS MCS, 2025. Aluminum · China · # · image
- Only 5 countries reported producing mined platinum in 2025, and the largest, South Africa, made 73% of the total. Source: USGS MCS, 2025. Platinum · South Africa · # · image
- Bangladesh produced 56% of the world's jute in 2024. The top five producers together made 99%. Source: FAOSTAT, 2024. Jute · Bangladesh · # · image
- China produced 52% of the world's coal in 2025. The top five producers together made 82%. Source: Energy Institute, 2025. Coal · China · # · image
- Madagascar produced 43% of the world's vanilla in 2024. The top five producers together made 85%. Source: FAOSTAT, 2024. Vanilla · Madagascar · # · image
- Russia produced 39% of the world's linseed in 2024. The top five producers together made 86%. Source: FAOSTAT, 2024. Linseed · Russia · # · image
- Five countries (China, Vietnam, Indonesia, Sri Lanka, Madagascar) produced 100% of the world's cinnamon in 2024. Source: FAOSTAT, 2024. Cinnamon · # · image
- China produced 38% of the world's cinnamon in 2024. The top five producers together made 100%. Source: FAOSTAT, 2024. Cinnamon · China · # · image
- The Philippines produced 39% of the world's coconut oil in 2023. The top five producers together made 87%. Source: FAOSTAT, 2023. Coconut oil · Philippines · # · image
- India produced 65% of the world's chickpeas in 2024. The top five producers together made 87%. Source: FAOSTAT, 2024. Chickpeas · India · # · image
- China produced 50% of the world's tea in 2024. The top five producers together made 86%. Source: FAOSTAT, 2024. Tea · China · # · image
- Only 9 countries reported producing mined nickel in 2025, and the largest, Indonesia, made 67% of the total. Source: USGS MCS, 2025. Nickel · Indonesia · # · image
- South Africa produced 73% of the world's mined platinum in 2025. The top five producers together made 100%. Source: USGS MCS, 2025. Platinum · South Africa · # · image
- South Africa produced 45% of the world's mined chromium in 2025. The top five producers together made 86%. Source: USGS MCS, 2025. Chromium · South Africa · # · image
Producer or exporter?
- China is the world's largest producer of mined phosphate rock (44% of output in 2025), but Morocco is the largest exporter of phosphate rock (HS 2510) (29% of world export value in 2024). China is 15th among exporters. Source: CEPII BACI, 2024. Phosphate rock · China · Morocco · # · image
- Russia is the world's largest producer of sunflower oil (31% of output in 2023), but Ukraine is the largest exporter of sunflower and safflower oil (HS 1512) (28% of world export value in 2024). Russia is 2nd among exporters. Source: CEPII BACI, 2024. Sunflower oil · Russia · Ukraine · # · image
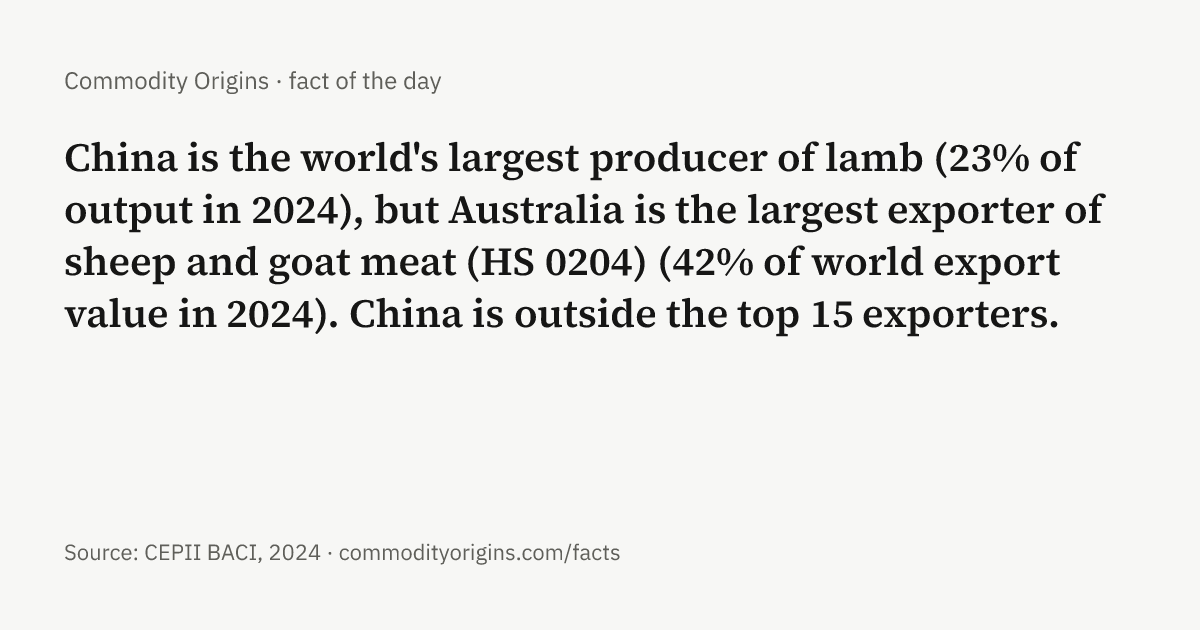
- China is the world's largest producer of lamb (23% of output in 2024), but Australia is the largest exporter of sheep and goat meat (HS 0204) (42% of world export value in 2024). China is outside the top 15 exporters. Source: CEPII BACI, 2024. Lamb · China · Australia · # · image
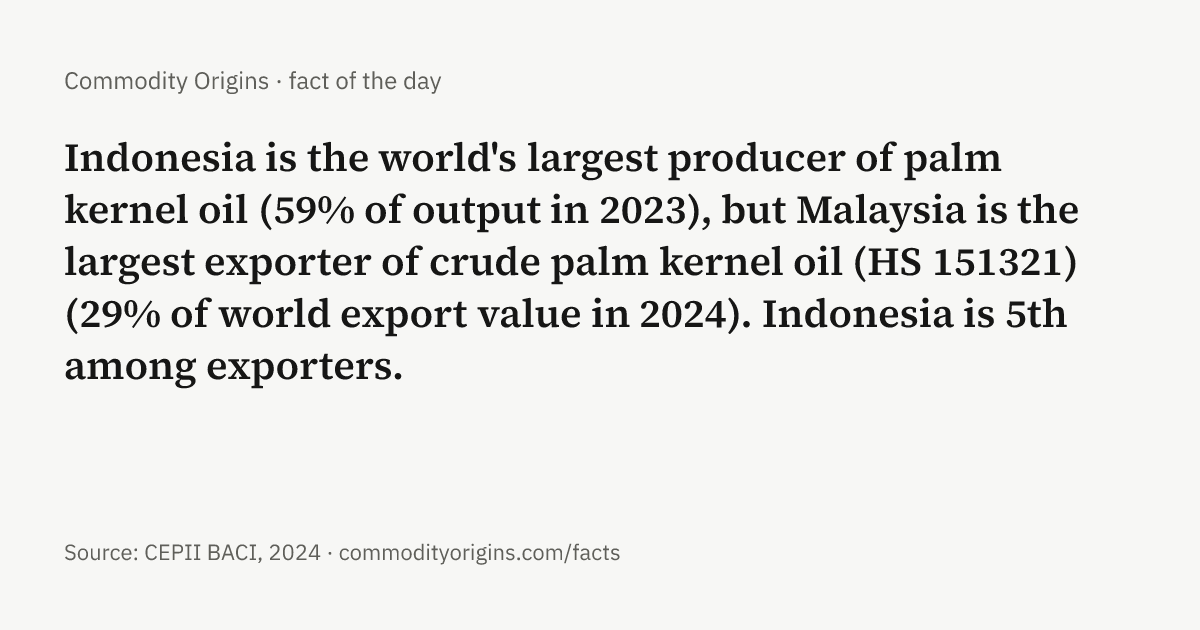
- Indonesia is the world's largest producer of palm kernel oil (59% of output in 2023), but Malaysia is the largest exporter of crude palm kernel oil (HS 151321) (29% of world export value in 2024). Indonesia is 5th among exporters. Source: CEPII BACI, 2024. Palm kernel oil · Indonesia · Malaysia · # · image
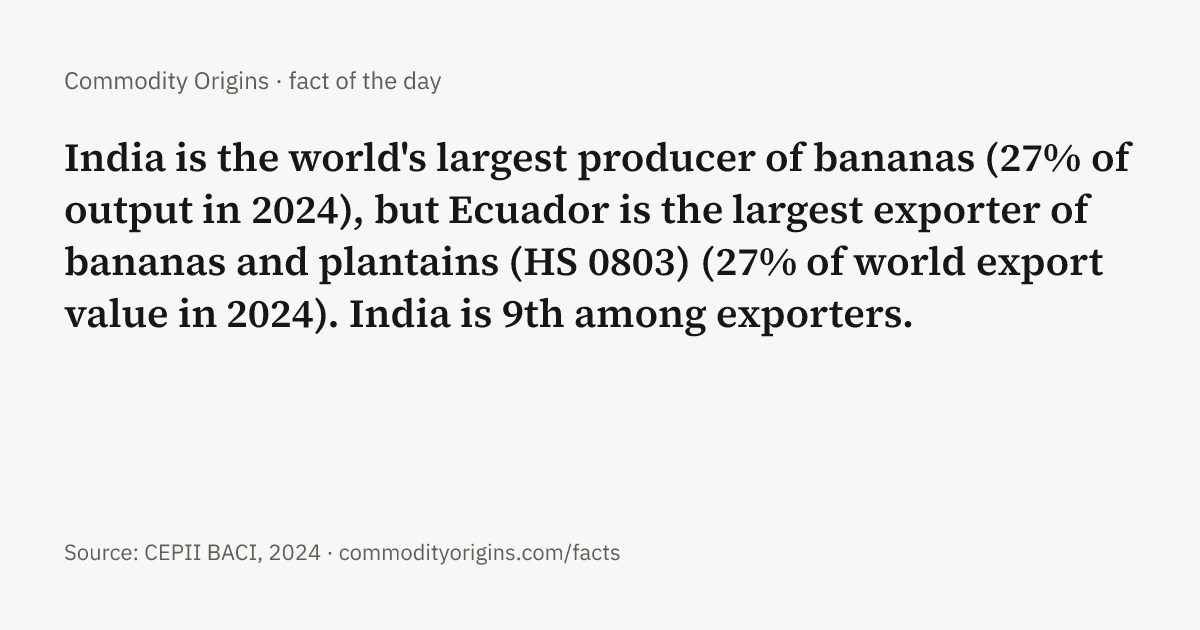
- India is the world's largest producer of bananas (27% of output in 2024), but Ecuador is the largest exporter of bananas and plantains (HS 0803) (27% of world export value in 2024). India is 9th among exporters. Source: CEPII BACI, 2024. Bananas · India · Ecuador · # · image
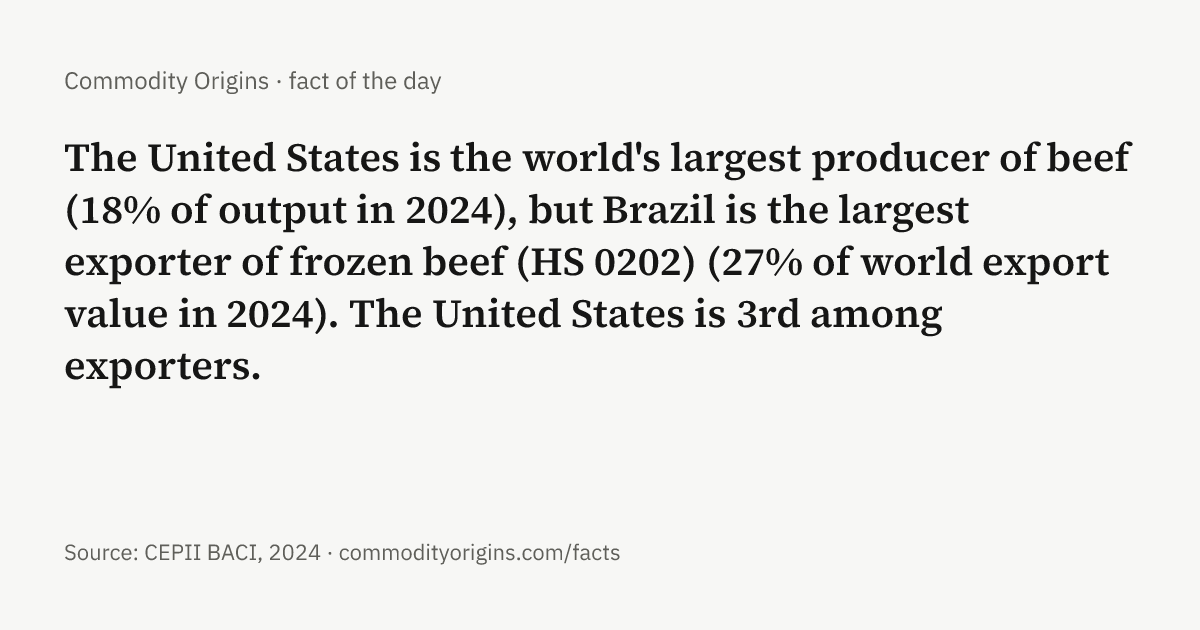
- The United States is the world's largest producer of beef (18% of output in 2024), but Brazil is the largest exporter of frozen beef (HS 0202) (27% of world export value in 2024). The United States is 3rd among exporters. Source: CEPII BACI, 2024. Beef · United States · Brazil · # · image
- Mexico is the world's largest producer of mined silver (24% of output in 2025), but China is the largest exporter of silver (HS 7106) (16% of world export value in 2024). Mexico is 3rd among exporters. Source: CEPII BACI, 2024. Silver · Mexico · China · # · image
- Brazil is the world's largest producer of oranges (23% of output in 2024), but Spain is the largest exporter of fresh oranges (HS 080510) (22% of world export value in 2024). Brazil is outside the top 15 exporters. Source: CEPII BACI, 2024. Oranges · Brazil · Spain · # · image
- China is the world's largest producer of mined molybdenum (37% of output in 2025), but Chile is the largest exporter of molybdenum ore (HS 2613) (24% of world export value in 2024). China is 6th among exporters. Source: CEPII BACI, 2024. Molybdenum · China · Chile · # · image
- India is the world's largest producer of ginger (48% of output in 2024), but China is the largest exporter of ginger (HS 091011) (56% of world export value in 2024). India is 5th among exporters. Source: CEPII BACI, 2024. Ginger · India · China · # · image
- India is the world's largest producer of chickpeas (65% of output in 2024), but Australia is the largest exporter of chickpeas (HS 071320) (24% of world export value in 2024). India is 4th among exporters. Source: CEPII BACI, 2024. Chickpeas · India · Australia · # · image
- The United States is the world's largest producer of sawnwood (17% of output in 2024), but Canada is the largest exporter of sawnwood (HS 4407) (17% of world export value in 2024). The United States is 4th among exporters. Source: CEPII BACI, 2024. Sawnwood · United States · Canada · # · image
- China is the world's largest producer of peanuts (34% of output in 2024), but Argentina is the largest exporter of raw groundnuts (HS 1202) (20% of world export value in 2024). China is 4th among exporters. Source: CEPII BACI, 2024. Peanuts · China · Argentina · # · image
- China is the world's largest producer of potatoes (24% of output in 2024), but France is the largest exporter of potatoes (HS 0701) (21% of world export value in 2024). China is 8th among exporters. Source: CEPII BACI, 2024. Potatoes · China · France · # · image
- China is the world's largest producer of cinnamon (38% of output in 2024), but Vietnam is the largest exporter of cinnamon (HS 0906) (28% of world export value in 2024). China is 4th among exporters. Source: CEPII BACI, 2024. Cinnamon · China · Vietnam · # · image
- China is the world's largest producer of eggs (35% of output in 2024), but the Netherlands is the largest exporter of eggs (HS 0407) (17% of world export value in 2024). China is 6th among exporters. Source: CEPII BACI, 2024. Eggs · China · Netherlands · # · image
- China is the world's largest producer of mined lead (42% of output in 2025), but India is the largest exporter of unwrought lead (HS 7801) (10% of world export value in 2024). China is outside the top 15 exporters. Source: CEPII BACI, 2024. Lead · China · India · # · image
- The Philippines is the world's largest producer of coconut oil (39% of output in 2023), but Indonesia is the largest exporter of coconut and palm kernel oil (HS 1513) (34% of world export value in 2024). The Philippines is 2nd among exporters. Source: CEPII BACI, 2024. Coconut oil · Philippines · Indonesia · # · image
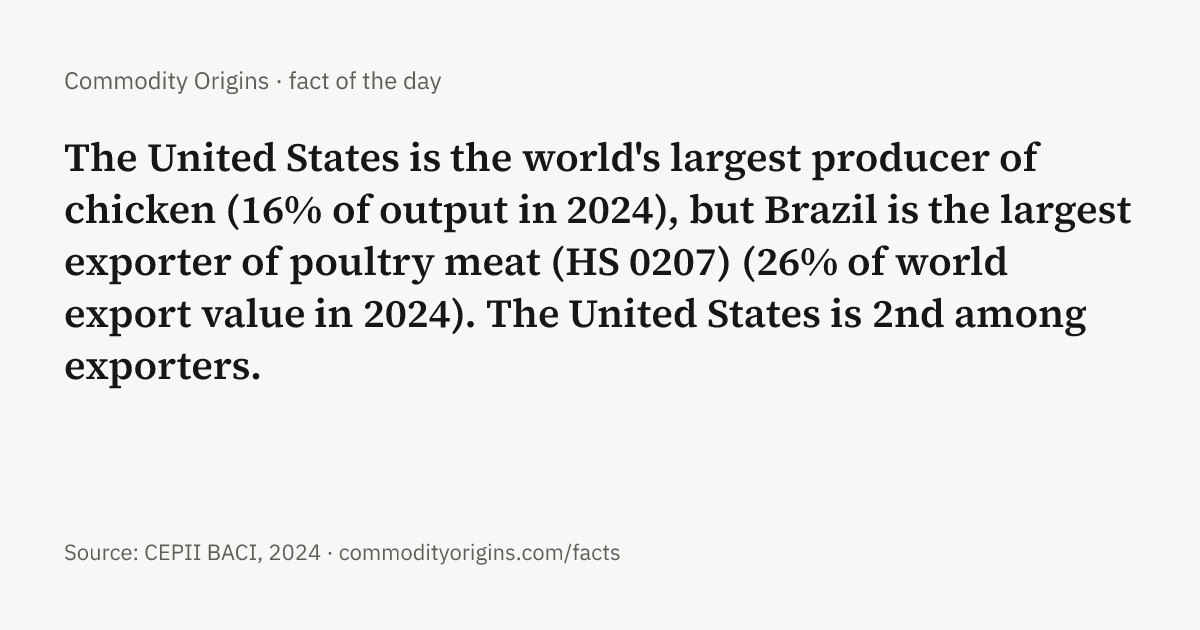
- The United States is the world's largest producer of chicken (16% of output in 2024), but Brazil is the largest exporter of poultry meat (HS 0207) (26% of world export value in 2024). The United States is 2nd among exporters. Source: CEPII BACI, 2024. Chicken · United States · Brazil · # · image
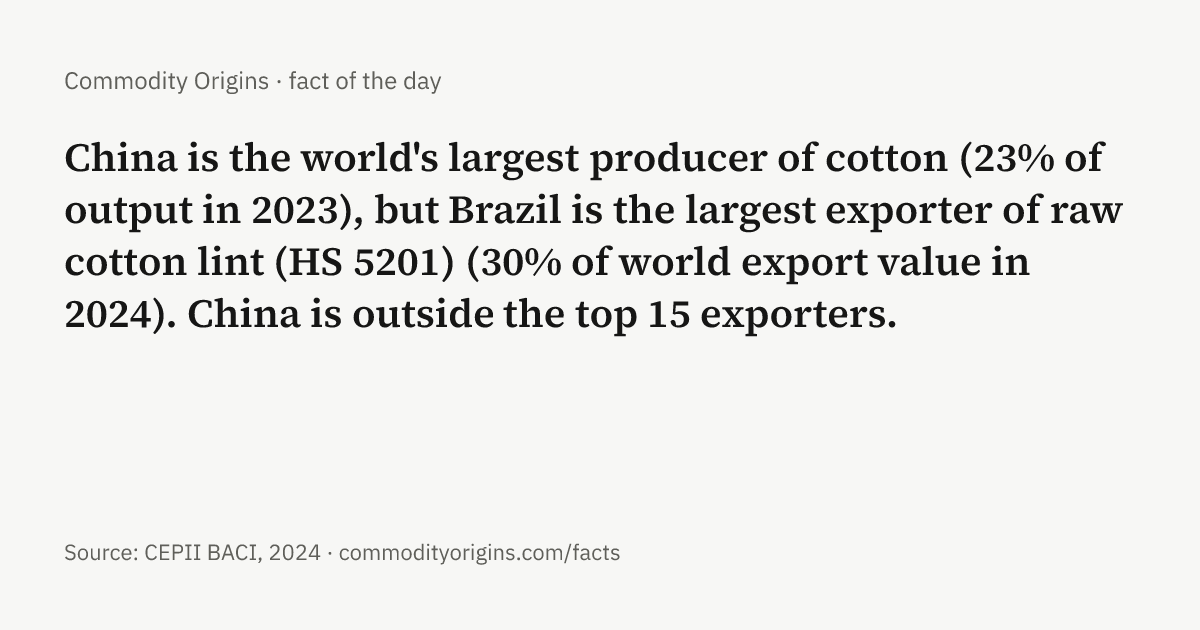
- China is the world's largest producer of cotton (23% of output in 2023), but Brazil is the largest exporter of raw cotton lint (HS 5201) (30% of world export value in 2024). China is outside the top 15 exporters. Source: CEPII BACI, 2024. Cotton · China · Brazil · # · image
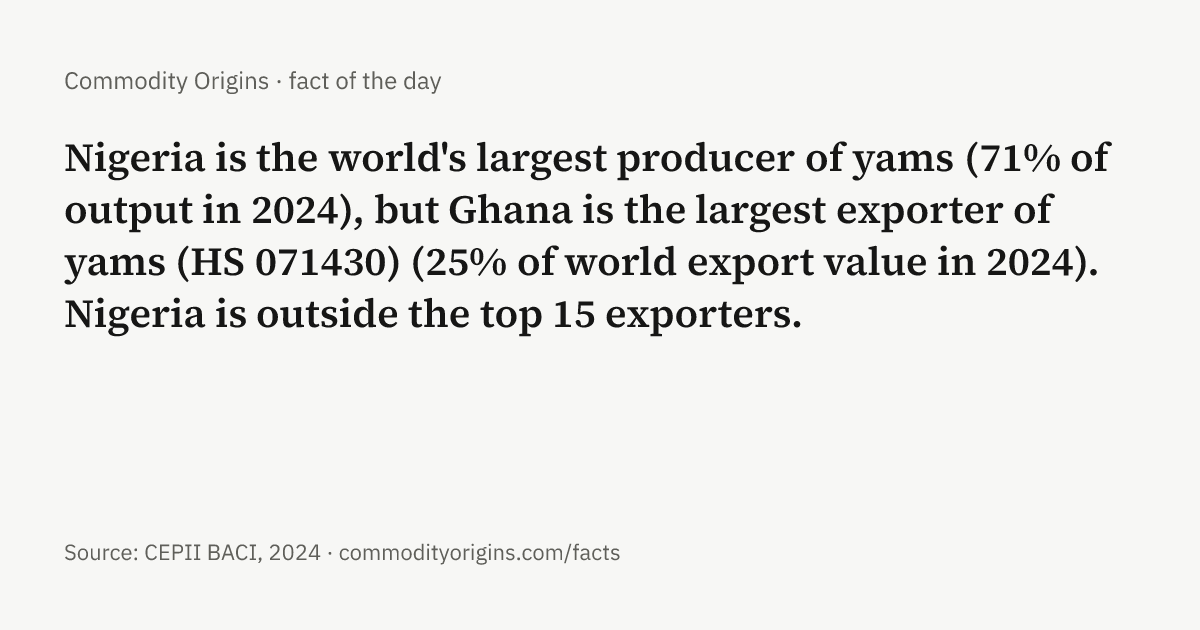
- Nigeria is the world's largest producer of yams (71% of output in 2024), but Ghana is the largest exporter of yams (HS 071430) (25% of world export value in 2024). Nigeria is outside the top 15 exporters. Source: CEPII BACI, 2024. Yams · Nigeria · Ghana · # · image
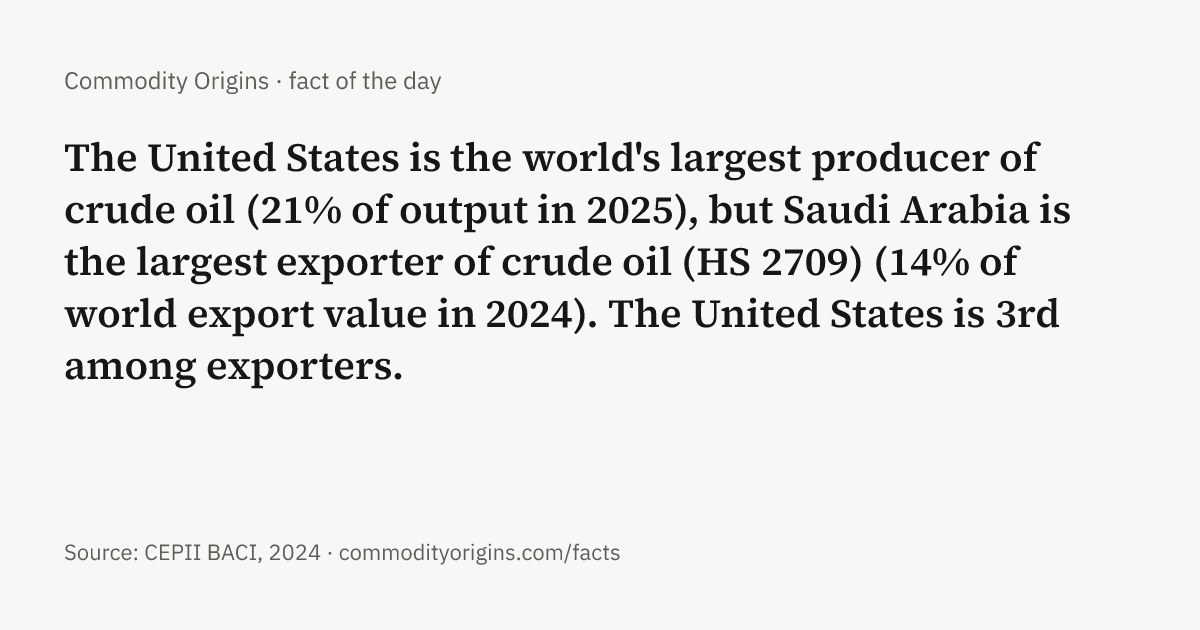
- The United States is the world's largest producer of crude oil (21% of output in 2025), but Saudi Arabia is the largest exporter of crude oil (HS 2709) (14% of world export value in 2024). The United States is 3rd among exporters. Source: CEPII BACI, 2024. Crude oil · United States · Saudi Arabia · # · image
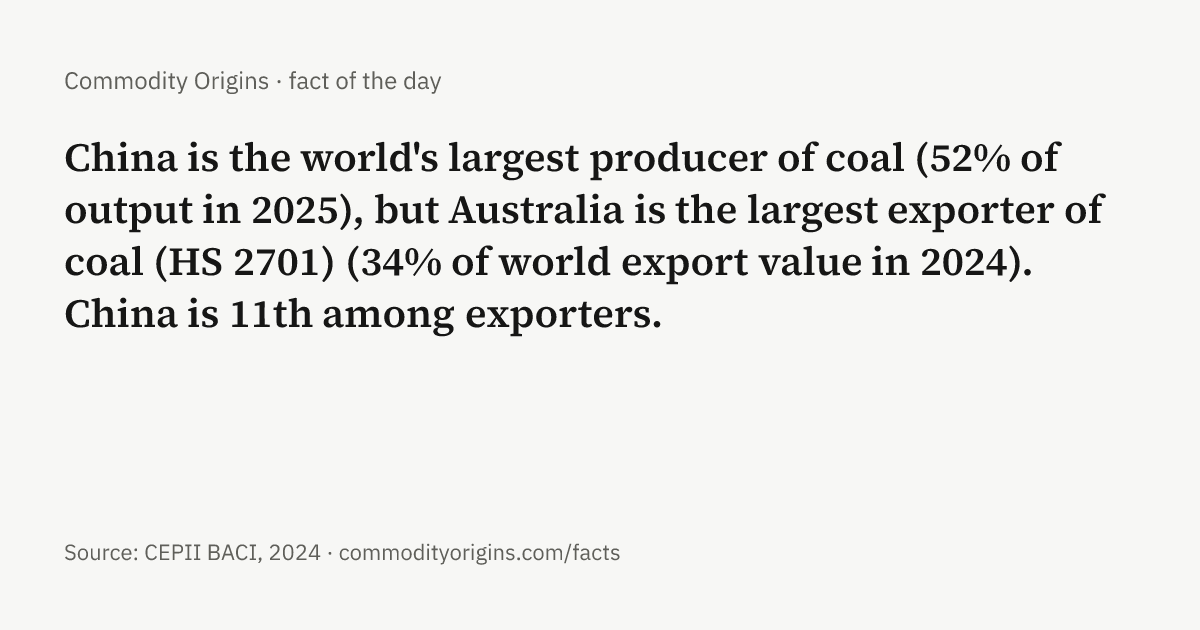
- China is the world's largest producer of coal (52% of output in 2025), but Australia is the largest exporter of coal (HS 2701) (34% of world export value in 2024). China is 11th among exporters. Source: CEPII BACI, 2024. Coal · China · Australia · # · image
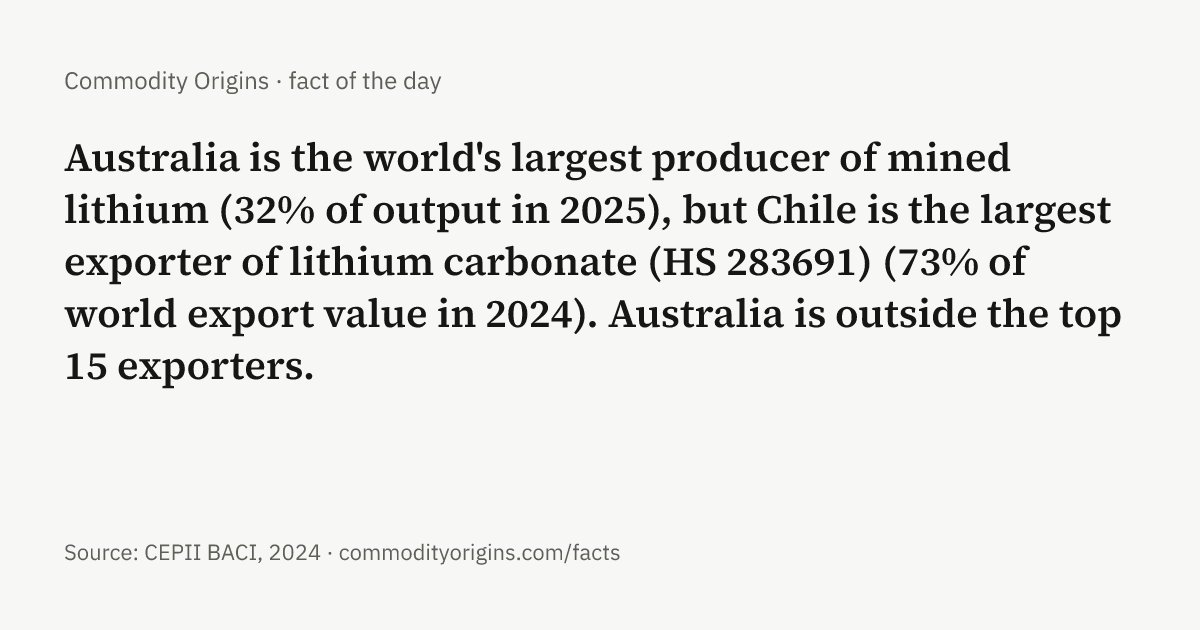
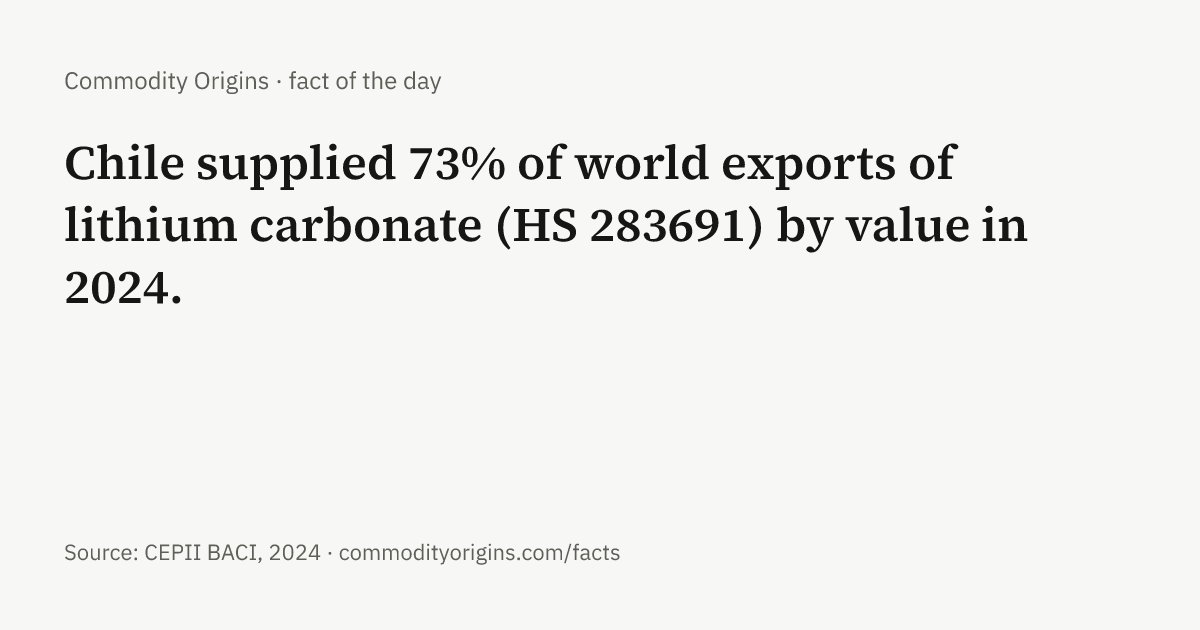
- Australia is the world's largest producer of mined lithium (32% of output in 2025), but Chile is the largest exporter of lithium carbonate (HS 283691) (73% of world export value in 2024). Australia is outside the top 15 exporters. Source: CEPII BACI, 2024. Lithium · Australia · Chile · # · image
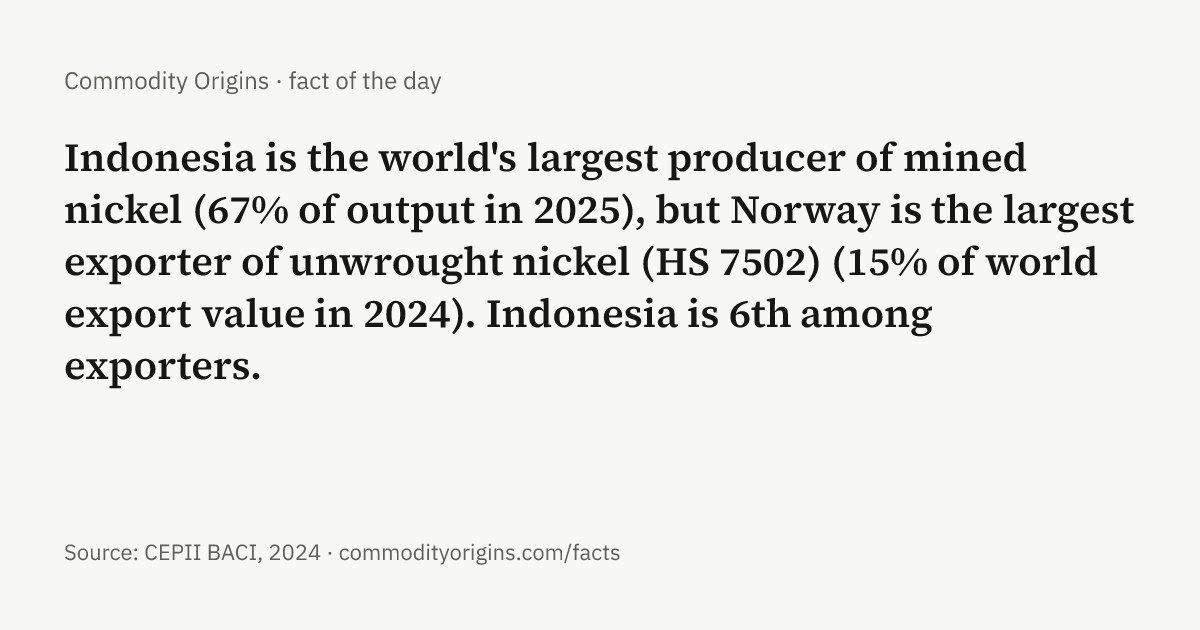
- Indonesia is the world's largest producer of mined nickel (67% of output in 2025), but Norway is the largest exporter of unwrought nickel (HS 7502) (15% of world export value in 2024). Indonesia is 6th among exporters. Source: CEPII BACI, 2024. Nickel · Indonesia · Norway · # · image
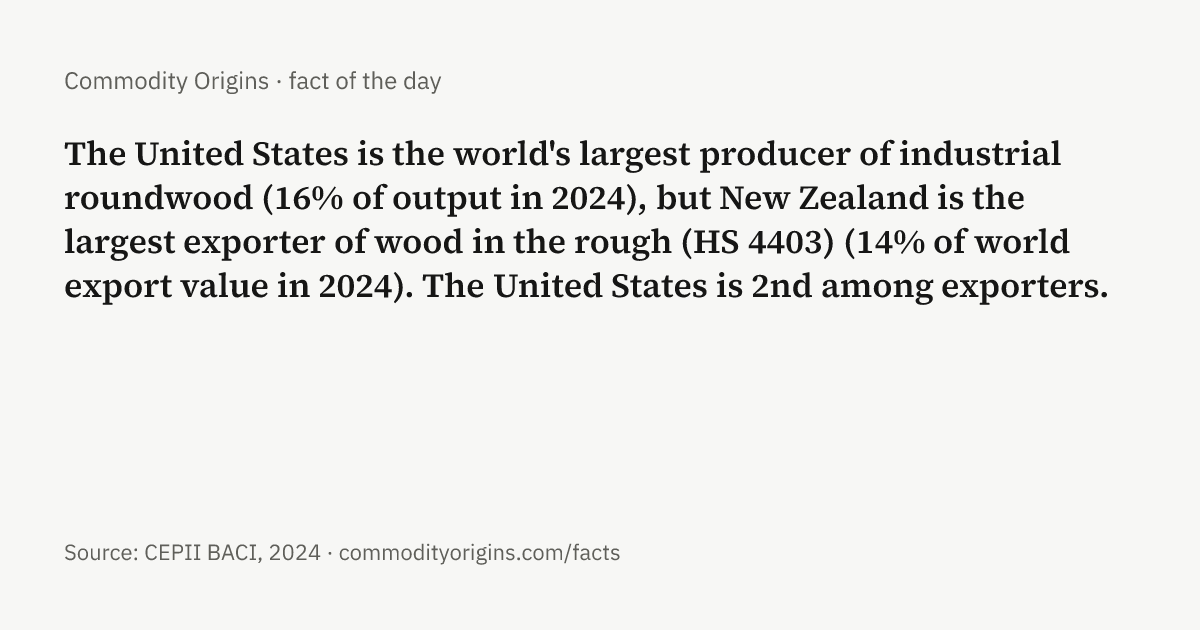
- The United States is the world's largest producer of industrial roundwood (16% of output in 2024), but New Zealand is the largest exporter of wood in the rough (HS 4403) (14% of world export value in 2024). The United States is 2nd among exporters. Source: CEPII BACI, 2024. Logs · United States · New Zealand · # · image
- India is the world's largest producer of milk (17% of output in 2024), but New Zealand is the largest exporter of milk powders (HS 0402) (28% of world export value in 2024). India is outside the top 15 exporters. Source: CEPII BACI, 2024. Milk · India · New Zealand · # · image
- China is the world's largest producer of tomatoes (33% of output in 2024), but Mexico is the largest exporter of tomatoes (HS 0702) (29% of world export value in 2024). China is 10th among exporters. Source: CEPII BACI, 2024. Tomatoes · China · Mexico · # · image
- Uganda is the world's largest producer of plantains (27% of output in 2024), but Ecuador is the largest exporter of plantains (HS 080310) (23% of world export value in 2024). Uganda is outside the top 15 exporters. Source: CEPII BACI, 2024. Plantains · Uganda · Ecuador · # · image
- China is the world's largest producer of pork (46% of output in 2024), but the United States is the largest exporter of pork (HS 0203) (18% of world export value in 2024). China is outside the top 15 exporters. Source: CEPII BACI, 2024. Pork · China · United States · # · image
- China is the world's largest producer of primary aluminum (61% of output in 2025), but Canada is the largest exporter of unwrought aluminum (HS 7601) (10% of world export value in 2024). China is outside the top 15 exporters. Source: CEPII BACI, 2024. Aluminum · China · Canada · # · image
- China is the world's largest producer of tobacco (37% of output in 2024), but Brazil is the largest exporter of unmanufactured tobacco (HS 2401) (20% of world export value in 2024). China is 7th among exporters. Source: CEPII BACI, 2024. Tobacco · China · Brazil · # · image
- The United States is the world's largest producer of cheese (28% of output in 2023), but Germany is the largest exporter of cheese (HS 0406) (15% of world export value in 2024). The United States is 5th among exporters. Source: CEPII BACI, 2024. Cheese · United States · Germany · # · image
- China is the world's largest producer of grapes (22% of output in 2024), but Peru is the largest exporter of grapes (HS 0806) (14% of world export value in 2024). China is 3rd among exporters. Source: CEPII BACI, 2024. Grapes · China · Peru · # · image
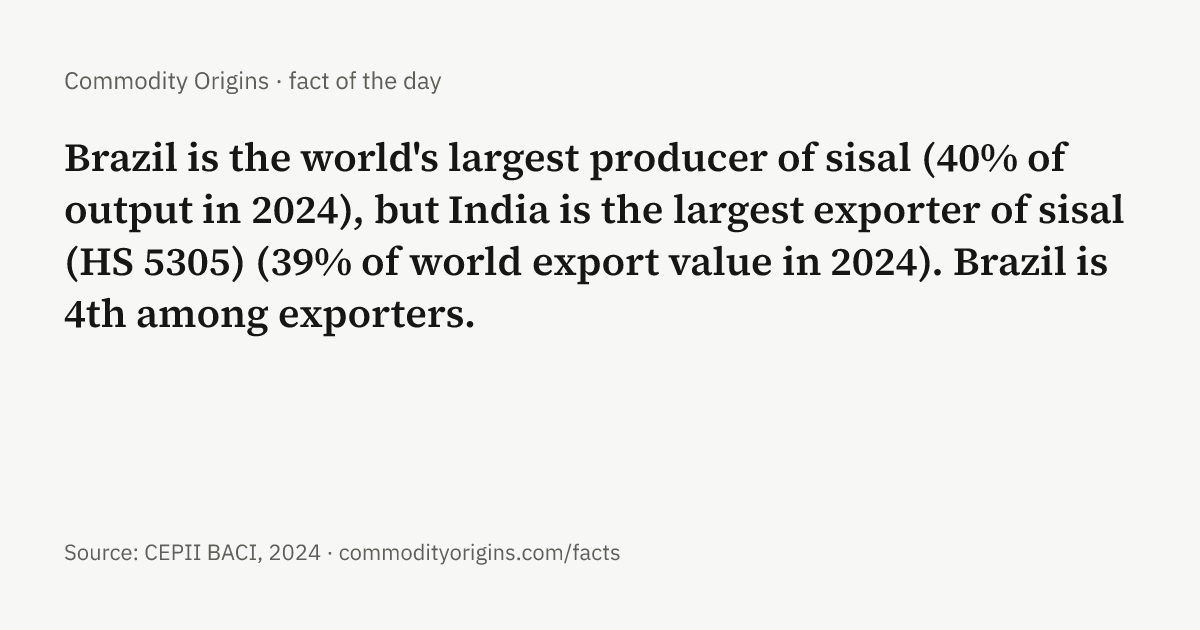
- Brazil is the world's largest producer of sisal (40% of output in 2024), but India is the largest exporter of sisal (HS 5305) (39% of world export value in 2024). Brazil is 4th among exporters. Source: CEPII BACI, 2024. Sisal · Brazil · India · # · image
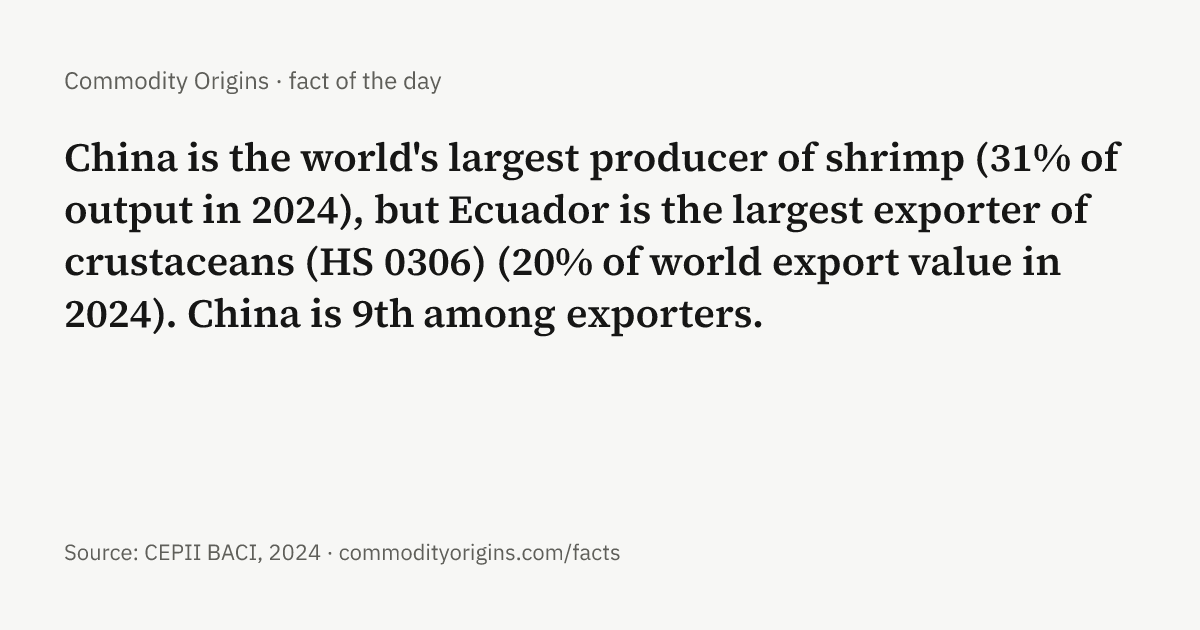
- China is the world's largest producer of shrimp (31% of output in 2024), but Ecuador is the largest exporter of crustaceans (HS 0306) (20% of world export value in 2024). China is 9th among exporters. Source: CEPII BACI, 2024. Shrimp · China · Ecuador · # · image
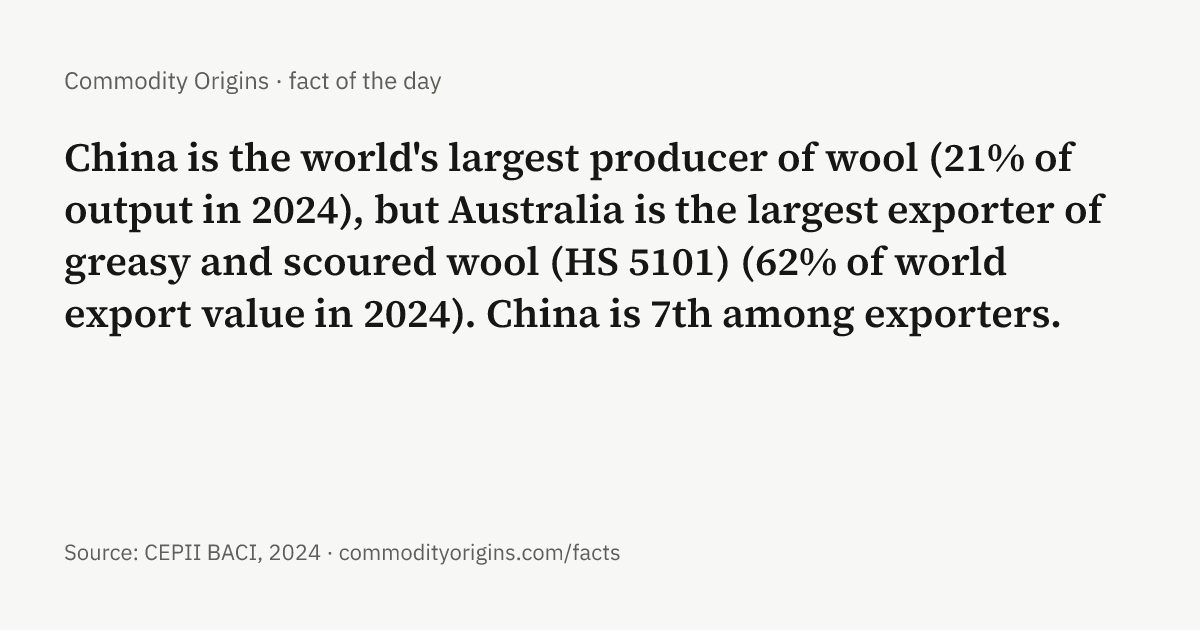
- China is the world's largest producer of wool (21% of output in 2024), but Australia is the largest exporter of greasy and scoured wool (HS 5101) (62% of world export value in 2024). China is 7th among exporters. Source: CEPII BACI, 2024. Wool · China · Australia · # · image
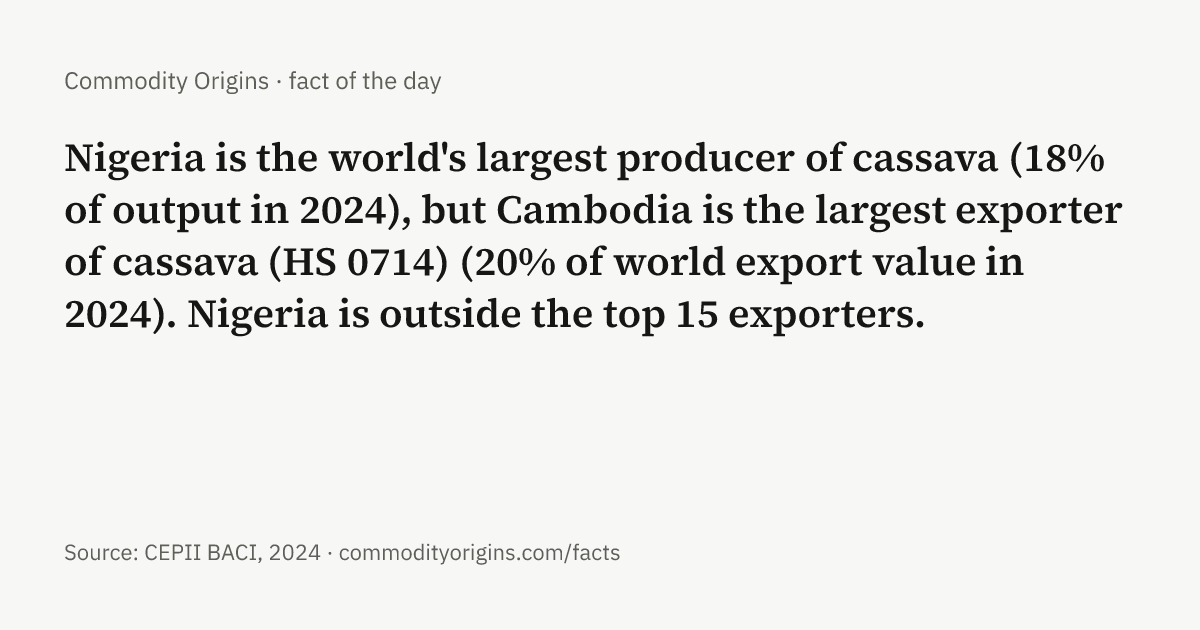
- Nigeria is the world's largest producer of cassava (18% of output in 2024), but Cambodia is the largest exporter of cassava (HS 0714) (20% of world export value in 2024). Nigeria is outside the top 15 exporters. Source: CEPII BACI, 2024. Cassava · Nigeria · Cambodia · # · image
- China is the world's largest producer of tea (50% of output in 2024), but Kenya is the largest exporter of tea (HS 0902) (18% of world export value in 2024). China is 3rd among exporters. Source: CEPII BACI, 2024. Tea · China · Kenya · # · image
- India is the world's largest producer of mangoes (45% of output in 2024), but Thailand is the largest exporter of mangoes (HS 080450) (18% of world export value in 2024). India is 7th among exporters. Source: CEPII BACI, 2024. Mangoes · India · Thailand · # · image
- Vietnam is the world's largest producer of pepper (28% of output in 2024), but India is the largest exporter of pepper (HS 0904) (24% of world export value in 2024). Vietnam is 2nd among exporters. Source: CEPII BACI, 2024. Pepper · Vietnam · India · # · image
- China is the world's largest producer of wheat (18% of output in 2024), but Russia is the largest exporter of wheat grain (HS 1001) (16% of world export value in 2024). China is outside the top 15 exporters. Source: CEPII BACI, 2024. Wheat · China · Russia · # · image
- China is the world's largest producer of mined tin (24% of output in 2025), but Indonesia is the largest exporter of unwrought tin (HS 8001) (26% of world export value in 2024). China is 5th among exporters. Source: CEPII BACI, 2024. Tin · China · Indonesia · # · image
- India is the world's largest producer of silk cocoons (56% of output in 2024), but China is the largest exporter of silk (HS 5002) (48% of world export value in 2024). India is 9th among exporters. Source: CEPII BACI, 2024. Silk · India · China · # · image
- China is the world's largest producer of honey (24% of output in 2024), but New Zealand is the largest exporter of honey (HS 0409) (11% of world export value in 2024). China is 2nd among exporters. Source: CEPII BACI, 2024. Honey · China · New Zealand · # · image
Fast risers and fallers
- Lamb output in Turkey (Türkiye) grew from 238,670 tonnes in 2014 to 509,539 tonnes in 2024, 7.9% a year for ten years. Source: FAOSTAT, 2024. Lamb · Turkey (Türkiye) · # · image
- Linseed output in Russia grew from 365,088 tonnes in 2014 to 1.2 million tonnes in 2024, 12.4% a year for ten years. Source: FAOSTAT, 2024. Linseed · Russia · # · image
- Olive oil output in Spain fell from 1.8 million tonnes in 2013 to 854,001 tonnes in 2023, 7% a year for ten years. Source: FAOSTAT, 2023. Olive oil · Spain · # · image
- Natural rubber output in Ivory Coast (Côte d'Ivoire) grew from 316,136 tonnes in 2014 to 1.7 million tonnes in 2024, 18.2% a year for ten years. Source: FAOSTAT, 2024. Natural rubber · Ivory Coast (Côte d'Ivoire) · # · image
- Sunflower oil output in Russia grew from 3.3 million tonnes in 2013 to 7 million tonnes in 2023, 7.8% a year for ten years. Source: FAOSTAT, 2023. Sunflower oil · Russia · # · image
- Cotton output in Brazil grew from 1.1 million tonnes in 2013 to 2.9 million tonnes in 2023, 10% a year for ten years. Source: FAOSTAT, 2023. Cotton · Brazil · # · image
- Pepper output in Brazil grew from 42,339 tonnes in 2014 to 124,925 tonnes in 2024, 11.4% a year for ten years. Source: FAOSTAT, 2024. Pepper · Brazil · # · image
- Cashews output in Tanzania grew from 130,124 tonnes in 2014 to 528,262 tonnes in 2024, 15% a year for ten years. Source: FAOSTAT, 2024. Cashews · Tanzania · # · image
- Coal output in the United States fell from 813.7 million tonnes in 2015 to 483.6 million tonnes in 2025, 5.1% a year for ten years. Source: Energy Institute, 2025. Coal · United States · # · image
- Eggs output in Indonesia grew from 1.2 million tonnes in 2014 to 6.6 million tonnes in 2024, 18.1% a year for ten years. Source: FAOSTAT, 2024. Eggs · Indonesia · # · image
- Ginger output in India grew from 655,000 tonnes in 2014 to 2.3 million tonnes in 2024, 13.5% a year for ten years. Source: FAOSTAT, 2024. Ginger · India · # · image
- Plywood output in India grew from 5.9 million cubic metres in 2014 to 12 million cubic metres in 2024, 7.3% a year for ten years. Source: FAOSTAT forestry, 2024. Plywood · India · # · image
- Chicken output in Indonesia grew from 1.9 million tonnes in 2014 to 4.2 million tonnes in 2024, 8% a year for ten years. Source: FAOSTAT, 2024. Chicken · Indonesia · # · image
- Natural gas output in Australia grew from 74 billion cubic metres in 2015 to 149 billion cubic metres in 2025, 7.2% a year for ten years. Source: Energy Institute, 2025. Natural gas · Australia · # · image
- Lentils output in Australia grew from 242,100 tonnes in 2014 to 1.3 million tonnes in 2024, 18% a year for ten years. Source: FAOSTAT, 2024. Lentils · Australia · # · image
- Avocados output in Colombia grew from 288,739 tonnes in 2014 to 1.3 million tonnes in 2024, 15.9% a year for ten years. Source: FAOSTAT, 2024. Avocados · Colombia · # · image
- Cassava output in Tanzania grew from 5 million tonnes in 2014 to 10.5 million tonnes in 2024, 7.7% a year for ten years. Source: FAOSTAT, 2024. Cassava · Tanzania · # · image
- Shrimp output in Ecuador grew from 349,304 tonnes in 2014 to 1.2 million tonnes in 2024, 13.4% a year for ten years. Source: FAO FishStat, 2024. Shrimp · Ecuador · # · image
- Canola output in Russia grew from 1.3 million tonnes in 2014 to 4.6 million tonnes in 2024, 13.2% a year for ten years. Source: FAOSTAT, 2024. Canola · Russia · # · image
- Linseed output in Canada fell from 883,300 tonnes in 2014 to 257,974 tonnes in 2024, 11.6% a year for ten years. Source: FAOSTAT, 2024. Linseed · Canada · # · image
- Oats output in Brazil grew from 432,136 tonnes in 2014 to 1.1 million tonnes in 2024, 9.7% a year for ten years. Source: FAOSTAT, 2024. Oats · Brazil · # · image
- Chickpeas output in Australia grew from 555,400 tonnes in 2014 to 2.3 million tonnes in 2024, 15.1% a year for ten years. Source: FAOSTAT, 2024. Chickpeas · Australia · # · image
- Sorghum output in Mexico fell from 8.4 million tonnes in 2014 to 4.5 million tonnes in 2024, 6% a year for ten years. Source: FAOSTAT, 2024. Sorghum · Mexico · # · image
- Oats output in Russia fell from 5.3 million tonnes in 2014 to 3 million tonnes in 2024, 5.5% a year for ten years. Source: FAOSTAT, 2024. Oats · Russia · # · image
- Honey output in India grew from 61,961 tonnes in 2014 to 146,000 tonnes in 2024, 8.9% a year for ten years. Source: FAOSTAT, 2024. Honey · India · # · image
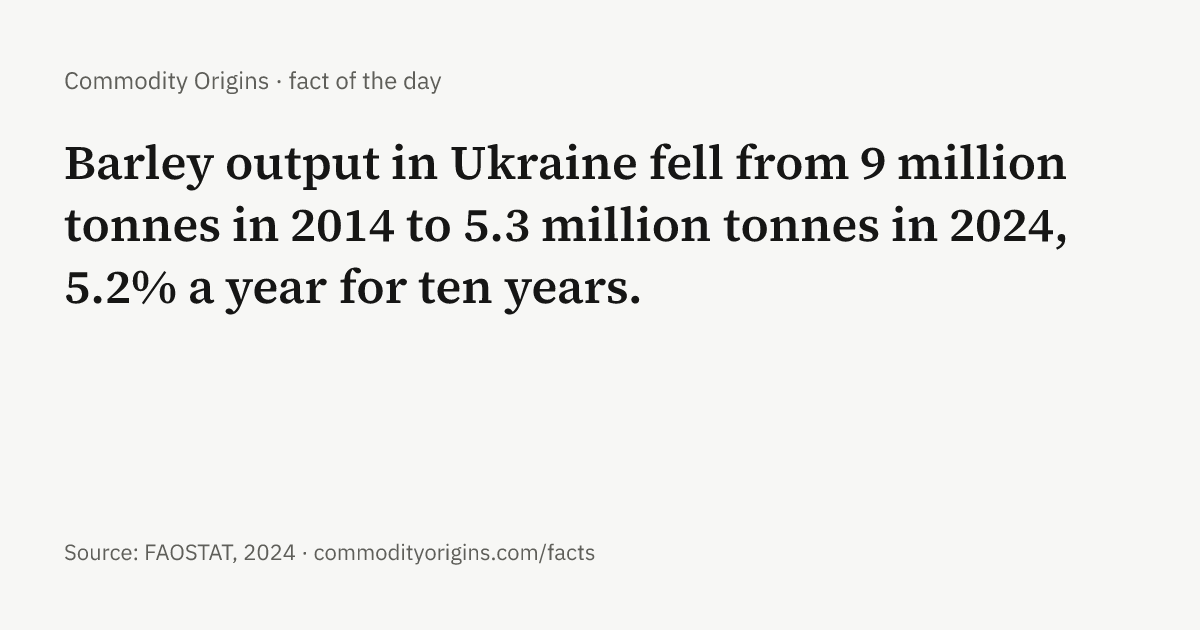
- Barley output in Ukraine fell from 9 million tonnes in 2014 to 5.3 million tonnes in 2024, 5.2% a year for ten years. Source: FAOSTAT, 2024. Barley · Ukraine · # · image
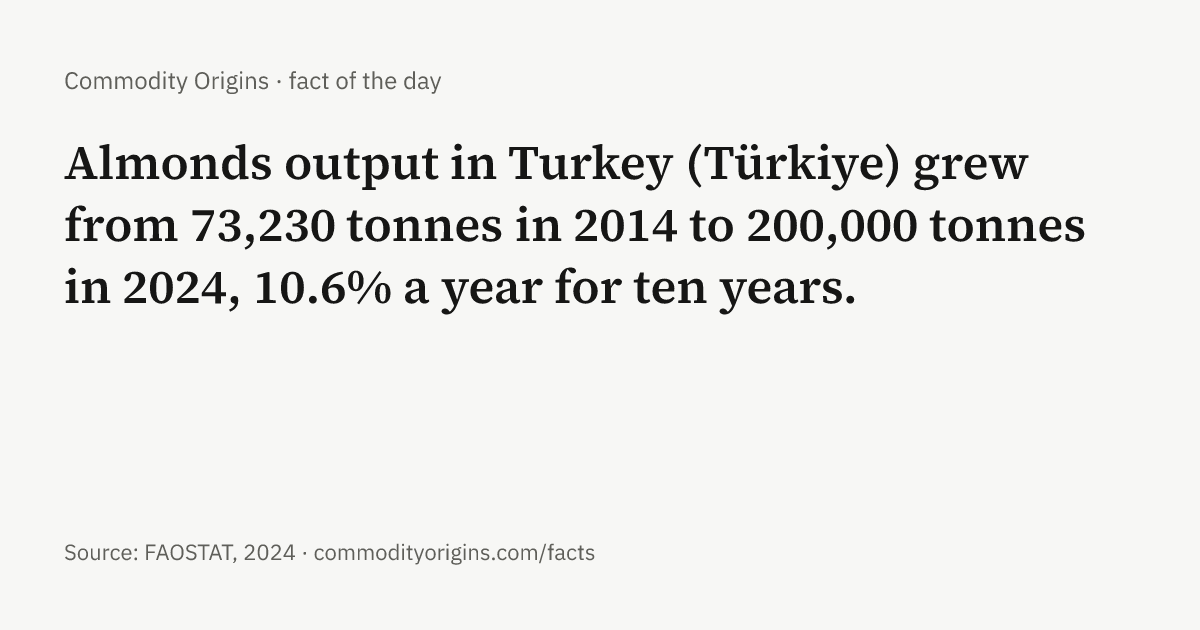
- Almonds output in Turkey (Türkiye) grew from 73,230 tonnes in 2014 to 200,000 tonnes in 2024, 10.6% a year for ten years. Source: FAOSTAT, 2024. Almonds · Turkey (Türkiye) · # · image
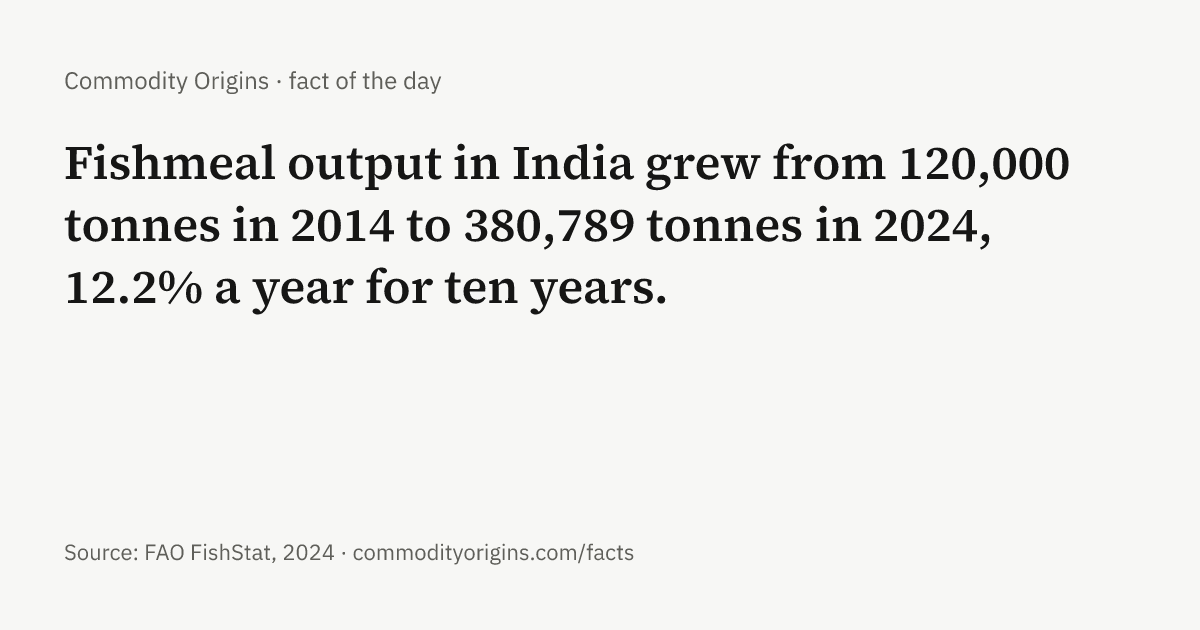
- Fishmeal output in India grew from 120,000 tonnes in 2014 to 380,789 tonnes in 2024, 12.2% a year for ten years. Source: FAO FishStat, 2024. Fishmeal · India · # · image
- Milk output in India grew from 66.4 million tonnes in 2014 to 135 million tonnes in 2024, 7.3% a year for ten years. Source: FAOSTAT, 2024. Milk · India · # · image
- Pineapples output in Thailand fell from 1.9 million tonnes in 2014 to 1.1 million tonnes in 2024, 5.5% a year for ten years. Source: FAOSTAT, 2024. Pineapples · Thailand · # · image
- Pistachios output in Turkey (Türkiye) grew from 80,000 tonnes in 2014 to 383,000 tonnes in 2024, 17% a year for ten years. Source: FAOSTAT, 2024. Pistachios · Turkey (Türkiye) · # · image
- Oranges output in the United States fell from 6.1 million tonnes in 2014 to 2.5 million tonnes in 2024, 8.6% a year for ten years. Source: FAOSTAT, 2024. Oranges · United States · # · image
- Silk cocoons output in China fell from 465,913 tonnes in 2014 to 147,000 tonnes in 2024, 10.9% a year for ten years. Source: FAOSTAT, 2024. Silk · China · # · image
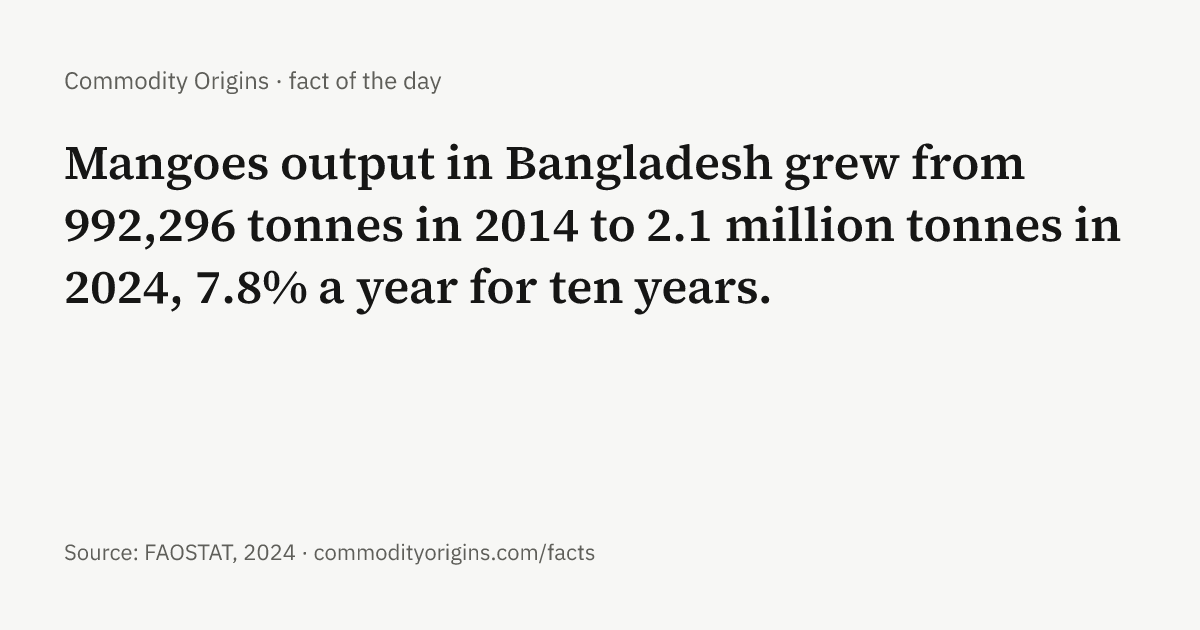
- Mangoes output in Bangladesh grew from 992,296 tonnes in 2014 to 2.1 million tonnes in 2024, 7.8% a year for ten years. Source: FAOSTAT, 2024. Mangoes · Bangladesh · # · image
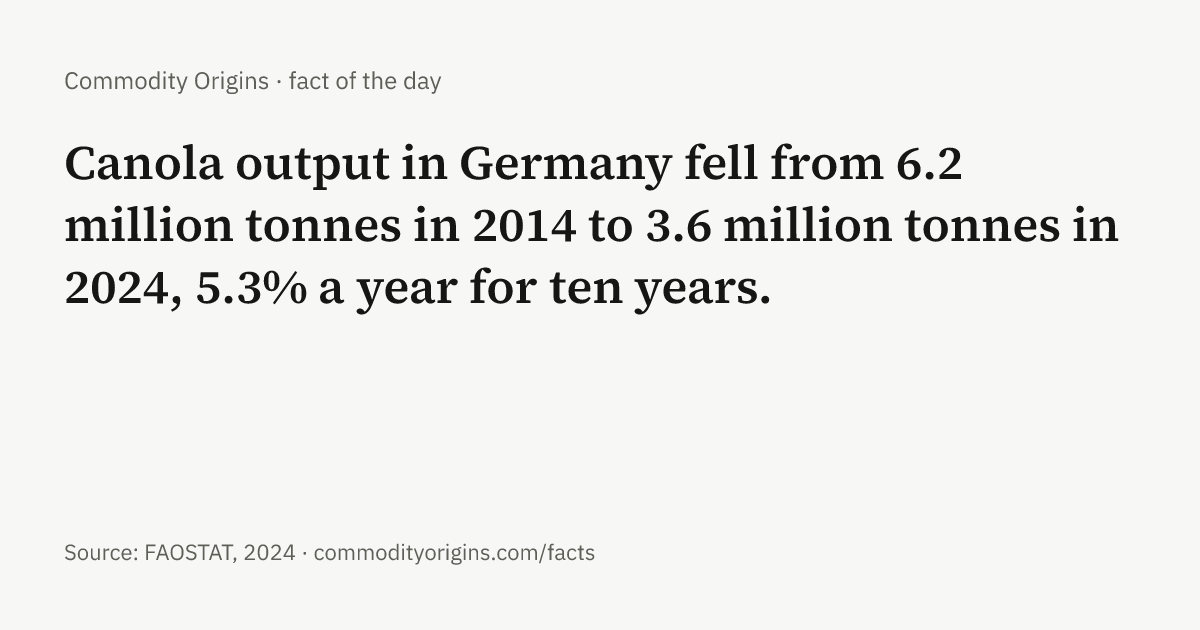
- Canola output in Germany fell from 6.2 million tonnes in 2014 to 3.6 million tonnes in 2024, 5.3% a year for ten years. Source: FAOSTAT, 2024. Canola · Germany · # · image
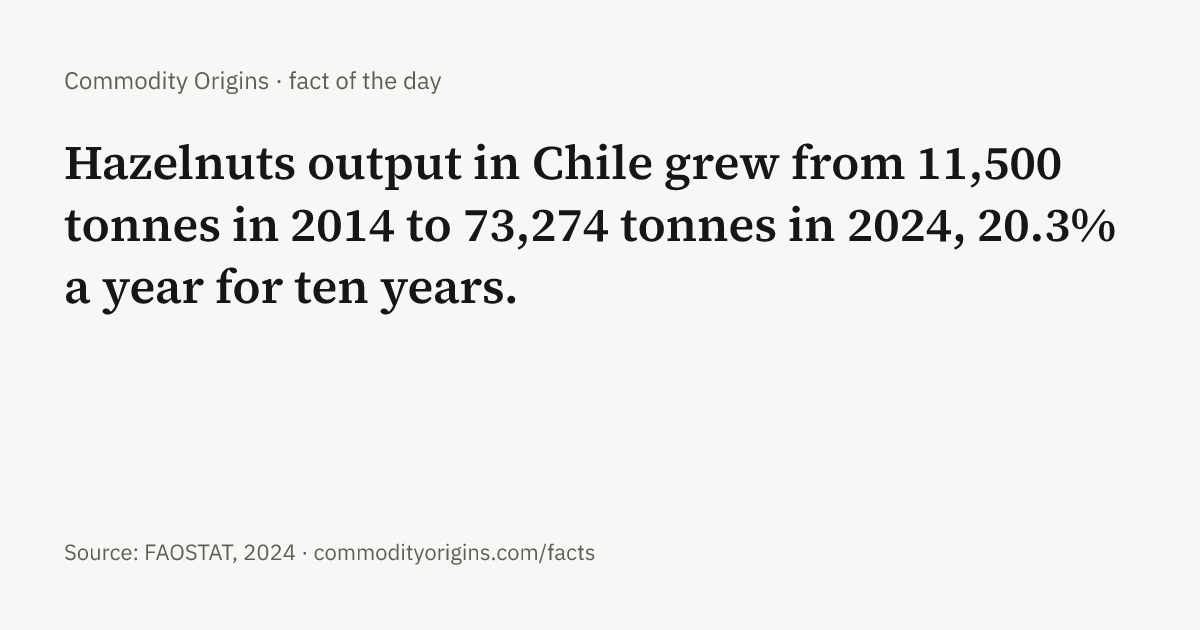
- Hazelnuts output in Chile grew from 11,500 tonnes in 2014 to 73,274 tonnes in 2024, 20.3% a year for ten years. Source: FAOSTAT, 2024. Hazelnuts · Chile · # · image
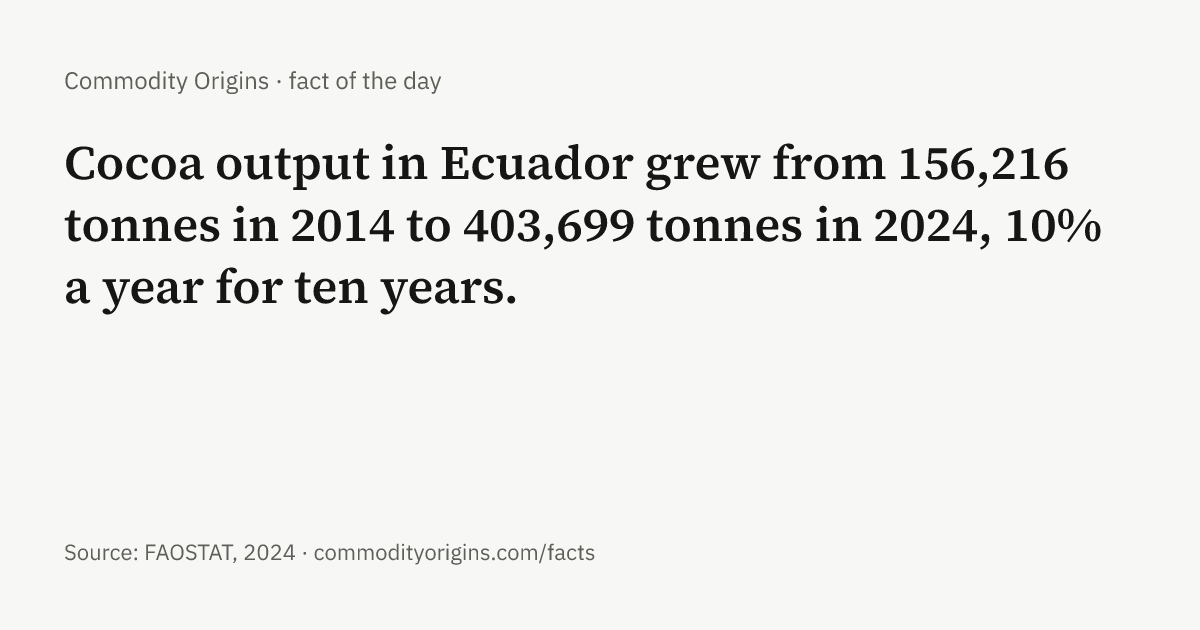
- Cocoa output in Ecuador grew from 156,216 tonnes in 2014 to 403,699 tonnes in 2024, 10% a year for ten years. Source: FAOSTAT, 2024. Cocoa · Ecuador · # · image
Long run
- World production of oats in 2024 was 54% below its 1961 level: 22.4 million tonnes against 48.6 million tonnes. Source: FAOSTAT, 2024. Oats · # · image
- World production of lentils in 2024 was 9.6 times what it was in 1961: 7.9 million tonnes against 818,077 tonnes. Source: FAOSTAT, 2024. Lentils · # · image
- World production of palm oil in 2023 was 54 times what it was in 1961: 79.6 million tonnes against 1.5 million tonnes. Source: FAOSTAT, 2023. Palm oil · # · image
- World production of yams in 2024 was 12 times what it was in 1961: 92.4 million tonnes against 8 million tonnes. Source: FAOSTAT, 2024. Yams · # · image
- World production of wool fell 16% in the ten years to 2024, from 2 million tonnes to 1.7 million tonnes. Source: FAOSTAT, 2024. Wool · # · image
- World production of sunflower oil in 2023 was 12 times what it was in 1961: 22.7 million tonnes against 1.9 million tonnes. Source: FAOSTAT, 2023. Sunflower oil · # · image
- World production of vanilla in 2024 was 5.2 times what it was in 1961: 7,115 tonnes against 1,380 tonnes. Source: FAOSTAT, 2024. Vanilla · # · image
- World production of pistachios in 2024 was 67 times what it was in 1961: 1.4 million tonnes against 20,714 tonnes. Source: FAOSTAT, 2024. Pistachios · # · image
- World production of eggs in 2024 was 6.4 times what it was in 1961: 89.3 million tonnes against 14.1 million tonnes. Source: FAOSTAT, 2024. Eggs · # · image
- World production of canola in 2024 was 25 times what it was in 1961: 87.9 million tonnes against 3.6 million tonnes. Source: FAOSTAT, 2024. Canola · # · image
- World production of chicken in 2024 was 17 times what it was in 1961: 127.9 million tonnes against 7.4 million tonnes. Source: FAOSTAT, 2024. Chicken · # · image
- World production of almonds in 2024 was 5.2 times what it was in 1961: 3.9 million tonnes against 755,388 tonnes. Source: FAOSTAT, 2024. Almonds · # · image
- World production of cocoa in 2024 was 4.4 times what it was in 1961: 5.2 million tonnes against 1.2 million tonnes. Source: FAOSTAT, 2024. Cocoa · # · image
- World production of pepper in 2024 was 13 times what it was in 1961: 933,416 tonnes against 71,068 tonnes. Source: FAOSTAT, 2024. Pepper · # · image
- World production of tea in 2024 was 33 times what it was in 1961: 32.7 million tonnes against 983,785 tonnes. Source: FAOSTAT, 2024. Tea · # · image
- World production of hazelnuts in 2024 was 6.6 times what it was in 1961: 1.2 million tonnes against 182,275 tonnes. Source: FAOSTAT, 2024. Hazelnuts · # · image
- World production of sisal in 2024 was 69% below its 1961 level: 233,961 tonnes against 761,928 tonnes. Source: FAOSTAT, 2024. Sisal · # · image
- World production of bananas in 2024 was 6.2 times what it was in 1961: 139.3 million tonnes against 22.3 million tonnes. Source: FAOSTAT, 2024. Bananas · # · image
- World production of shrimp in 2024 was 29 times what it was in 1950: 11.9 million tonnes against 413,490 tonnes. Source: FAO FishStat, 2024. Shrimp · # · image
- World production of oranges in 2024 was 4.2 times what it was in 1961: 67.1 million tonnes against 15.9 million tonnes. Source: FAOSTAT, 2024. Oranges · # · image
- World production of tomatoes in 2024 was 6.9 times what it was in 1961: 188.3 million tonnes against 27.2 million tonnes. Source: FAOSTAT, 2024. Tomatoes · # · image
- World production of cloves in 2024 was 7.2 times what it was in 1961: 198,941 tonnes against 27,770 tonnes. Source: FAOSTAT, 2024. Cloves · # · image
- World production of quinoa in 2024 was 5.1 times what it was in 1961: 165,893 tonnes against 32,435 tonnes. Source: FAOSTAT, 2024. Quinoa · # · image
- World production of pork in 2024 was 5.2 times what it was in 1961: 125.3 million tonnes against 24 million tonnes. Source: FAOSTAT, 2024. Pork · # · image
- World production of sesame seed in 2024 was 5.8 times what it was in 1961: 6.7 million tonnes against 1.2 million tonnes. Source: FAOSTAT, 2024. Sesame seed · # · image
- World production of soybeans in 2024 was 15 times what it was in 1961: 397.7 million tonnes against 26.9 million tonnes. Source: FAOSTAT, 2024. Soybeans · # · image
- World production of tobacco fell 16% in the ten years to 2024, from 7.2 million tonnes to 6 million tonnes. Source: FAOSTAT, 2024. Tobacco · # · image
- World production of avocados in 2024 was 16 times what it was in 1961: 11.2 million tonnes against 716,353 tonnes. Source: FAOSTAT, 2024. Avocados · # · image
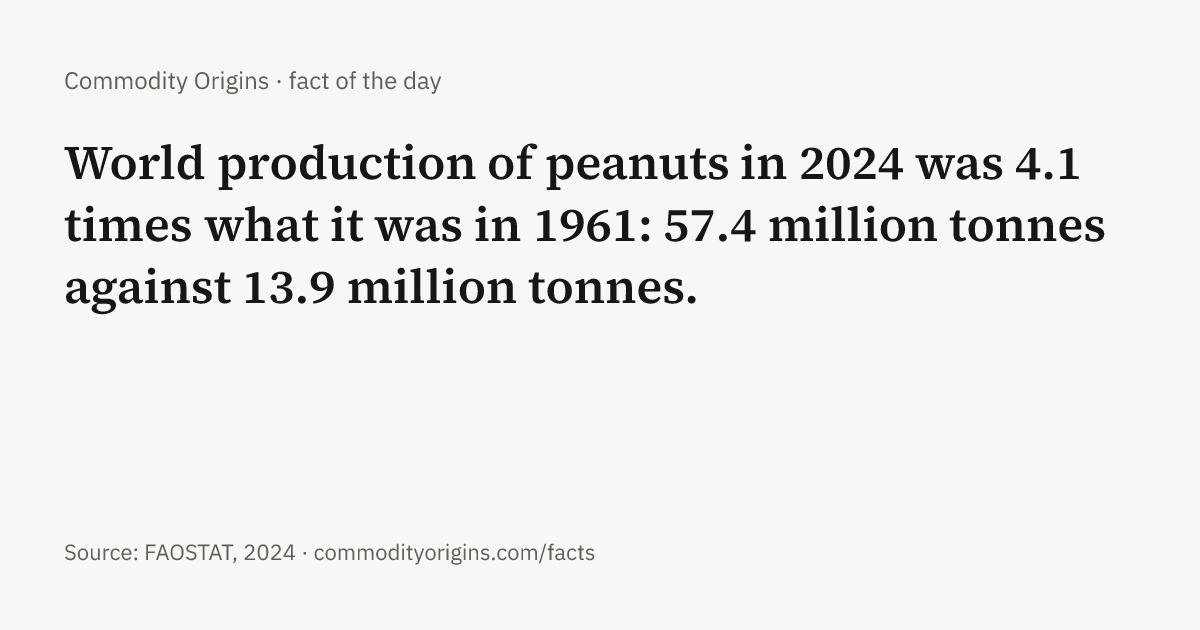
- World production of peanuts in 2024 was 4.1 times what it was in 1961: 57.4 million tonnes against 13.9 million tonnes. Source: FAOSTAT, 2024. Peanuts · # · image
- World production of palm kernel oil in 2023 was 18 times what it was in 1961: 8.4 million tonnes against 476,228 tonnes. Source: FAOSTAT, 2023. Palm kernel oil · # · image
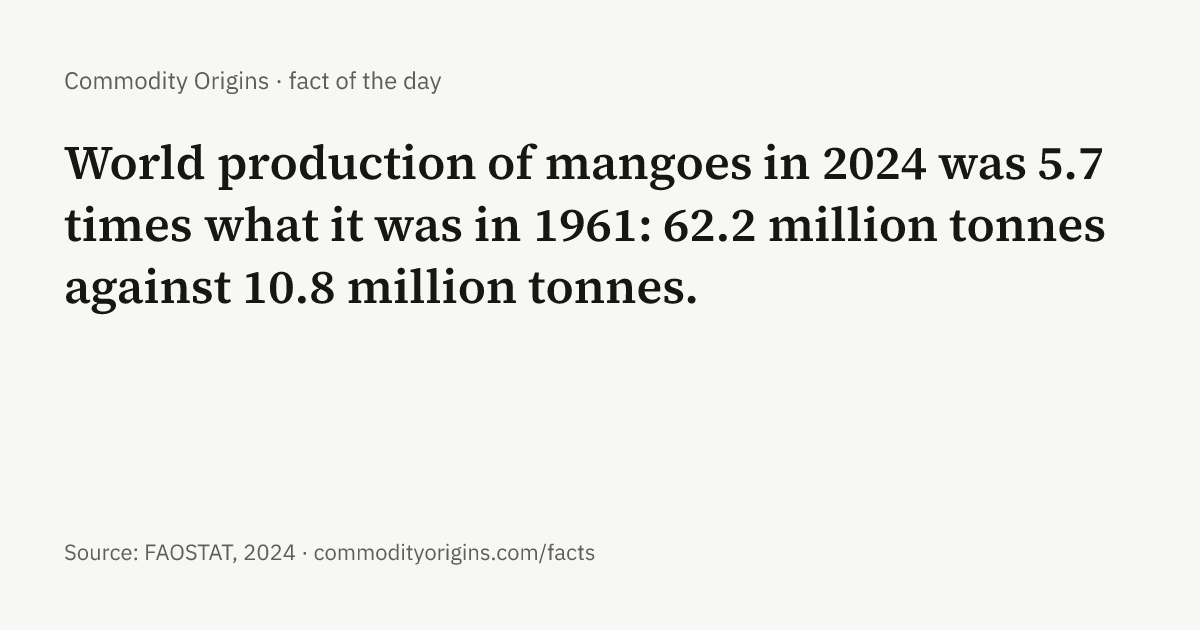
- World production of mangoes in 2024 was 5.7 times what it was in 1961: 62.2 million tonnes against 10.8 million tonnes. Source: FAOSTAT, 2024. Mangoes · # · image
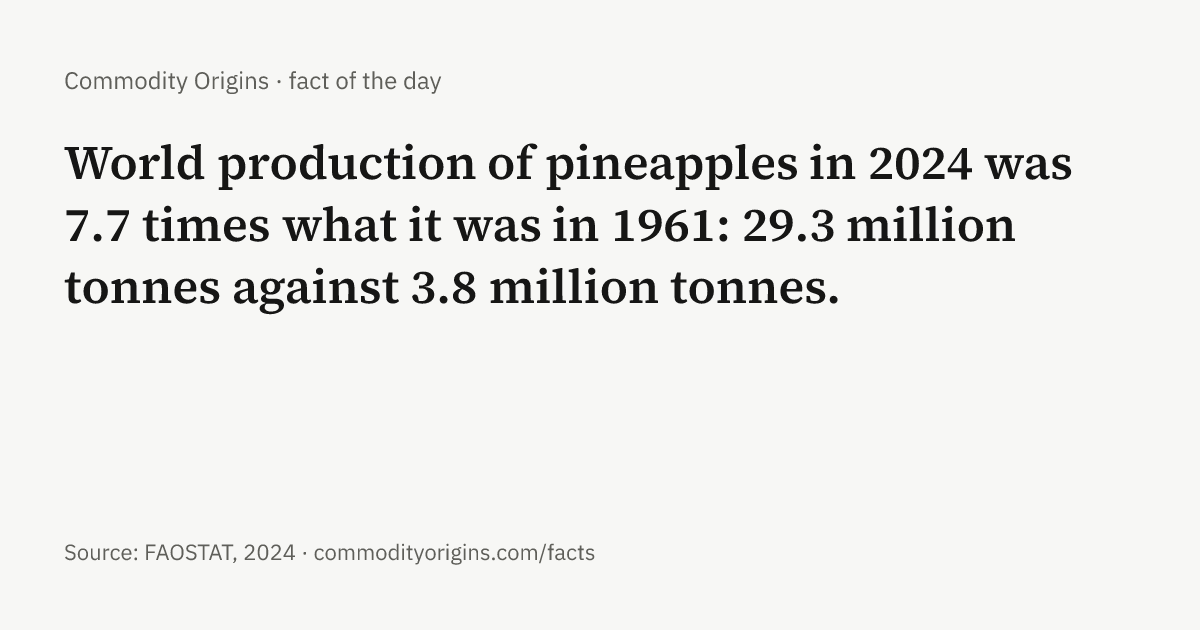
- World production of pineapples in 2024 was 7.7 times what it was in 1961: 29.3 million tonnes against 3.8 million tonnes. Source: FAOSTAT, 2024. Pineapples · # · image
- World production of cashews in 2024 was 15 times what it was in 1961: 4.2 million tonnes against 287,535 tonnes. Source: FAOSTAT, 2024. Cashews · # · image
- World production of dates in 2024 was 5.5 times what it was in 1961: 9.9 million tonnes against 1.8 million tonnes. Source: FAOSTAT, 2024. Dates · # · image
- World production of natural rubber in 2024 was 7 times what it was in 1961: 14.8 million tonnes against 2.1 million tonnes. Source: FAOSTAT, 2024. Natural rubber · # · image
- World production of cassava in 2024 was 4.8 times what it was in 1961: 341.6 million tonnes against 71.1 million tonnes. Source: FAOSTAT, 2024. Cassava · # · image
- World production of olive oil fell 25% in the ten years to 2023, from 3.5 million tonnes to 2.6 million tonnes. Source: FAOSTAT, 2023. Olive oil · # · image
- World production of cinnamon in 2024 was 12 times what it was in 1961: 244,815 tonnes against 19,912 tonnes. Source: FAOSTAT, 2024. Cinnamon · # · image
- World production of silk cocoons fell 34% in the ten years to 2024, from 701,835 tonnes to 464,010 tonnes. Source: FAOSTAT, 2024. Silk · # · image
- World production of apples in 2024 was 5.9 times what it was in 1961: 97.9 million tonnes against 16.6 million tonnes. Source: FAOSTAT, 2024. Apples · # · image
- World production of corn in 2024 was 6.1 times what it was in 1961: 1.2 billion tonnes against 199.7 million tonnes. Source: FAOSTAT, 2024. Corn · # · image
- World production of cheese in 2023 was 6.6 times what it was in 1961: 23 million tonnes against 3.5 million tonnes. Source: FAOSTAT, 2023. Cheese · # · image
- World production of ginger in 2024 was 81 times what it was in 1961: 4.9 million tonnes against 60,360 tonnes. Source: FAOSTAT, 2024. Ginger · # · image
Prices
- Adjusted for US inflation, wheat costs about 21% of what it did at its February 1974 peak (the World Bank series starts in 1960). Source: World Bank Pink Sheet, 2026. Wheat · Wheat prices · # · image
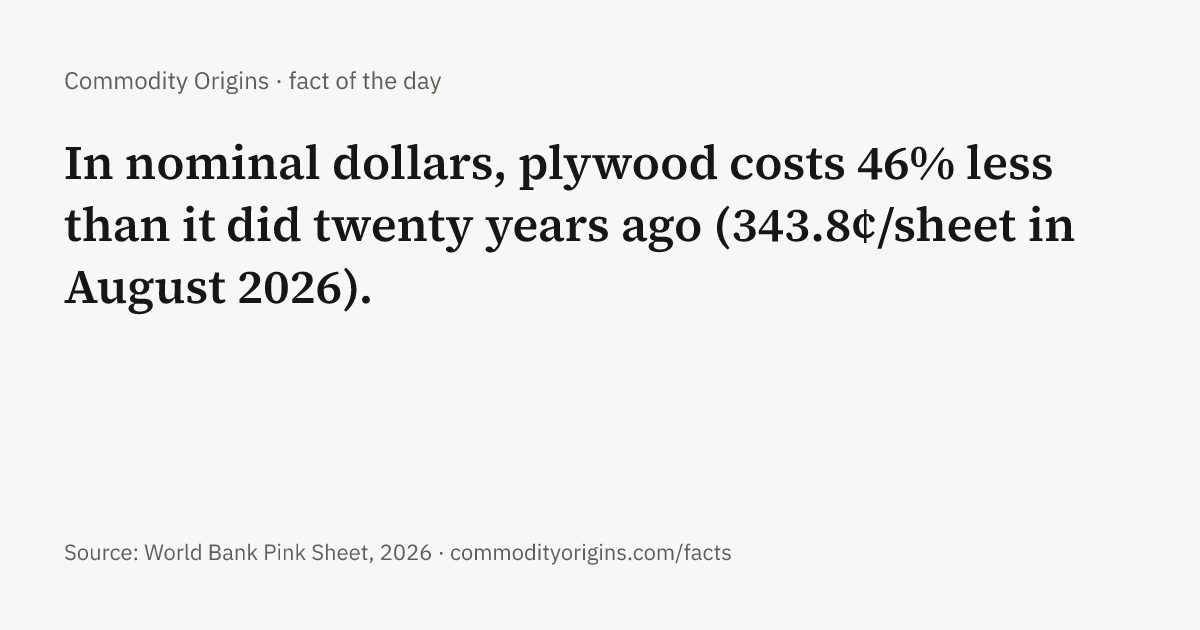
- In nominal dollars, plywood costs 46% less than it did twenty years ago (343.8¢/sheet in August 2026). Source: World Bank Pink Sheet, 2026. Plywood · Plywood prices · # · image
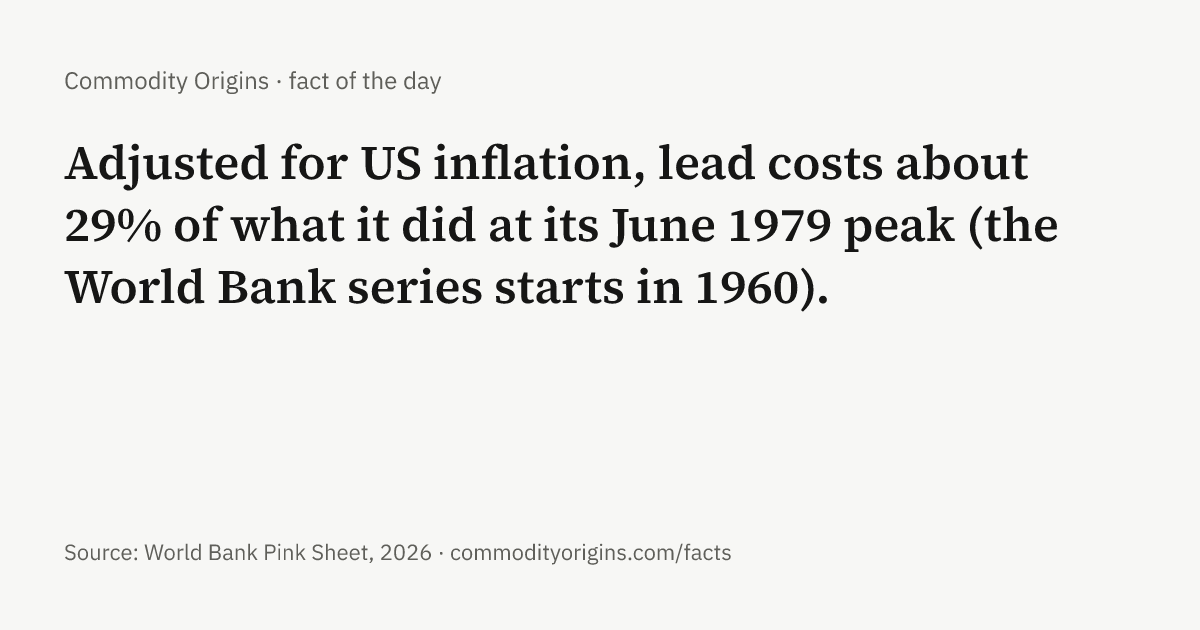
- Adjusted for US inflation, lead costs about 29% of what it did at its June 1979 peak (the World Bank series starts in 1960). Source: World Bank Pink Sheet, 2026. Lead · Lead prices · # · image
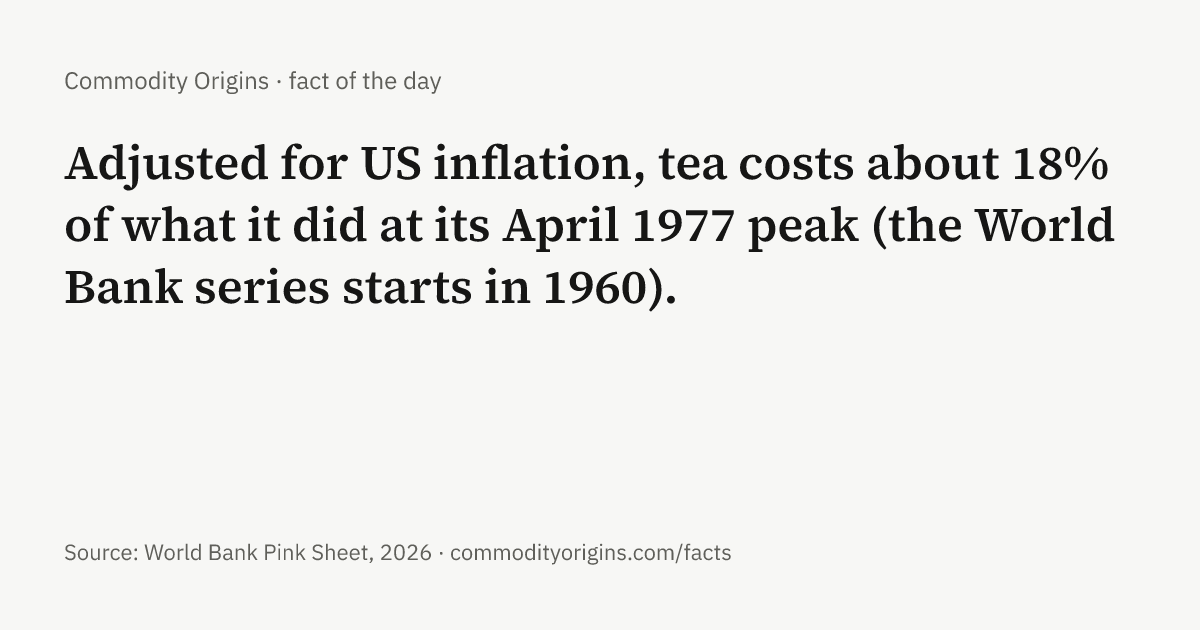
- Adjusted for US inflation, tea costs about 18% of what it did at its April 1977 peak (the World Bank series starts in 1960). Source: World Bank Pink Sheet, 2026. Tea · Tea prices · # · image
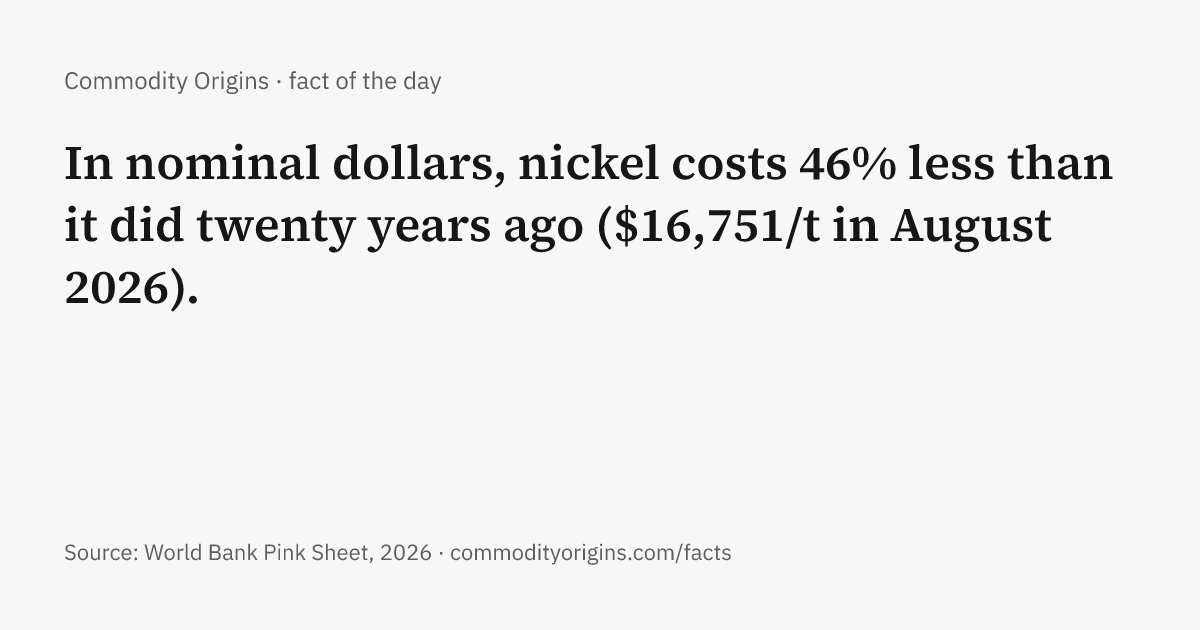
- In nominal dollars, nickel costs 46% less than it did twenty years ago ($16,751/t in August 2026). Source: World Bank Pink Sheet, 2026. Nickel · Nickel prices · # · image
- In nominal dollars, natural gas costs 60% less than it did twenty years ago ($2.77/MMBtu in August 2026). Source: World Bank Pink Sheet, 2026. Natural gas · Natural gas prices · # · image
- Adjusted for US inflation, corn costs about 23% of what it did at its October 1974 peak (the World Bank series starts in 1960). Source: World Bank Pink Sheet, 2026. Corn · Corn prices · # · image
- Gold's benchmark price is 7 times what it was twenty years ago in nominal dollars ($4,411/troy oz in August 2026). Source: World Bank Pink Sheet, 2026. Gold · Gold prices · # · image
- Adjusted for US inflation, peanuts costs about 13% of what it did at its November 1980 peak (the World Bank series starts in 1980). Source: World Bank Pink Sheet, 2026. Peanuts · Peanuts prices · # · image
- Palm kernel oil's benchmark price reached $2,606/t in April 2026, the highest monthly average in the World Bank series that starts in 1996. Adjusted for inflation it is still 35% below its February 2011 peak. Source: World Bank Pink Sheet, 2026. Palm kernel oil · Palm kernel oil prices · # · image
- Adjusted for US inflation, plywood costs about 20% of what it did at its May 1993 peak (the World Bank series starts in 1979). Source: World Bank Pink Sheet, 2026. Plywood · Plywood prices · # · image
- Adjusted for US inflation, rice costs about 11% of what it did at its April 1974 peak (the World Bank series starts in 1960). Source: World Bank Pink Sheet, 2026. Rice · Rice prices · # · image
- Beef's benchmark price reached $8.21/kg in March 2026, the highest monthly average in the World Bank series that starts in 1960. Adjusted for inflation it is still 60% below its August 1973 peak. Source: World Bank Pink Sheet, 2026. Beef · Beef prices · # · image
- Silver's benchmark price is 5.4 times what it was twenty years ago in nominal dollars ($65.4/troy oz in August 2026). Source: World Bank Pink Sheet, 2026. Silver · Silver prices · # · image
- Adjusted for US inflation, palm oil costs about 20% of what it did at its October 1974 peak (the World Bank series starts in 1960). Source: World Bank Pink Sheet, 2026. Palm oil · Palm oil prices · # · image
- Adjusted for US inflation, aluminum costs about 32% of what it did at its June 1988 peak (the World Bank series starts in 1960). Source: World Bank Pink Sheet, 2026. Aluminum · Aluminum prices · # · image
- Adjusted for US inflation, cotton costs about 15% of what it did at its January 1974 peak (the World Bank series starts in 1960). Source: World Bank Pink Sheet, 2026. Cotton · Cotton prices · # · image
- Tin's benchmark price is 64% higher than a year earlier (August 2026: $55,385/t). Source: World Bank Pink Sheet, 2026. Tin · Tin prices · # · image
- Adjusted for US inflation, soybeans costs about 14% of what it did at its June 1973 peak (the World Bank series starts in 1960). Source: World Bank Pink Sheet, 2026. Soybeans · Soybeans prices · # · image
- Adjusted for US inflation, cocoa costs about 25% of what it did at its July 1977 peak (the World Bank series starts in 1960). Source: World Bank Pink Sheet, 2026. Cocoa · Cocoa prices · # · image
- Adjusted for US inflation, urea costs about 19% of what it did at its January 1974 peak (the World Bank series starts in 1960). Source: World Bank Pink Sheet, 2026. Urea · Urea prices · # · image
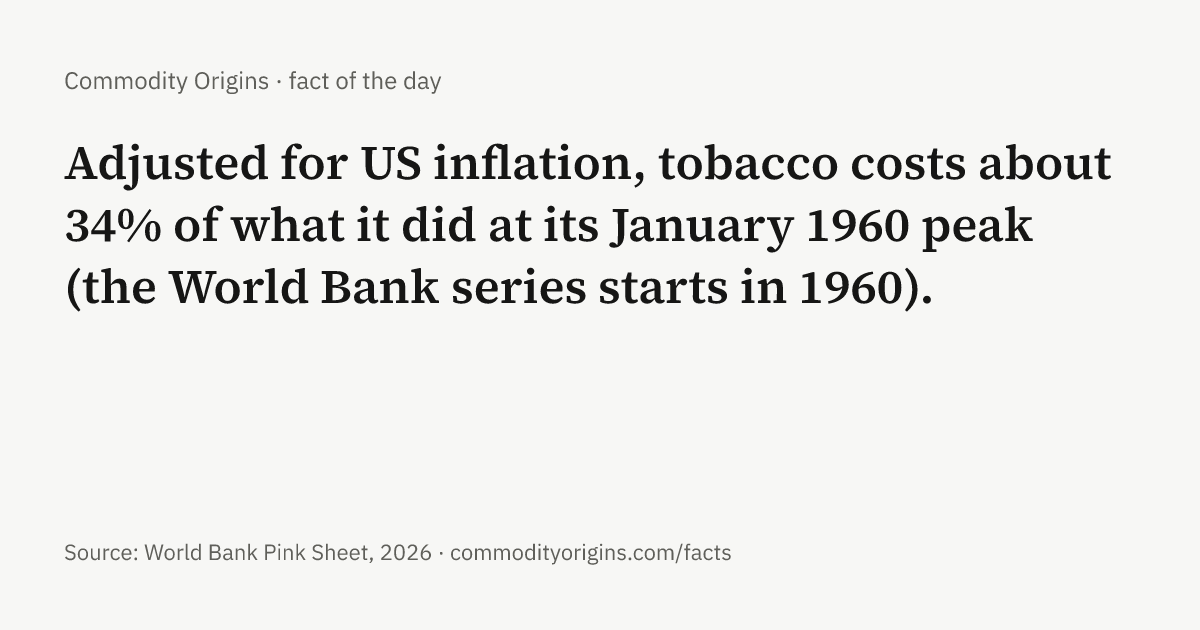
- Adjusted for US inflation, tobacco costs about 34% of what it did at its January 1960 peak (the World Bank series starts in 1960). Source: World Bank Pink Sheet, 2026. Tobacco · Tobacco prices · # · image
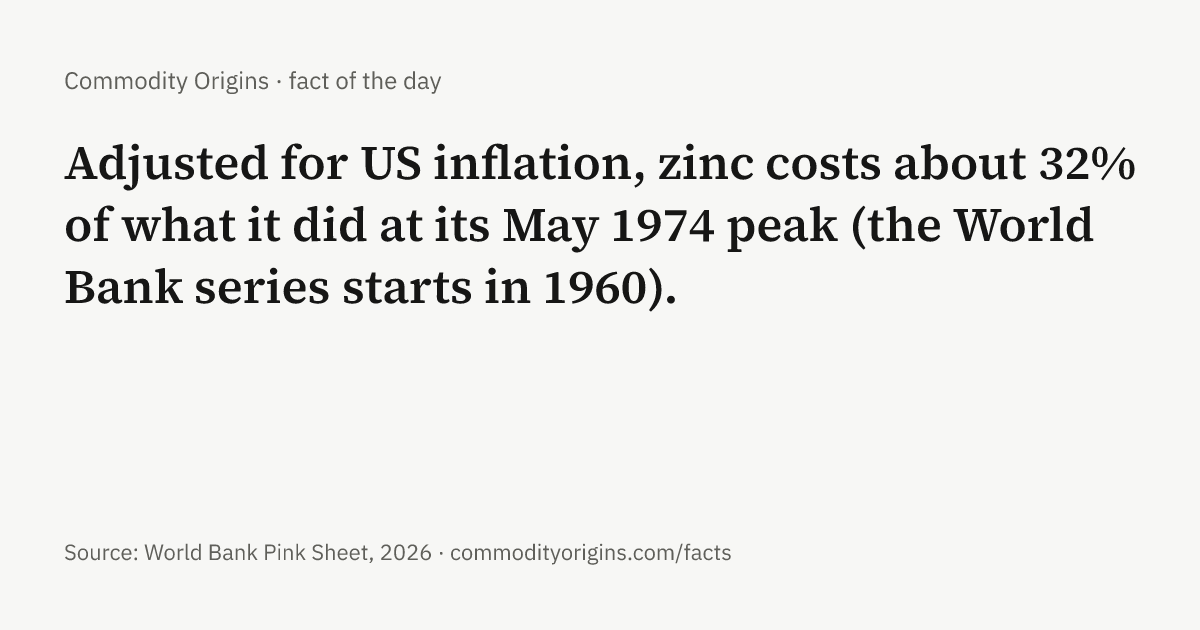
- Adjusted for US inflation, zinc costs about 32% of what it did at its May 1974 peak (the World Bank series starts in 1960). Source: World Bank Pink Sheet, 2026. Zinc · Zinc prices · # · image
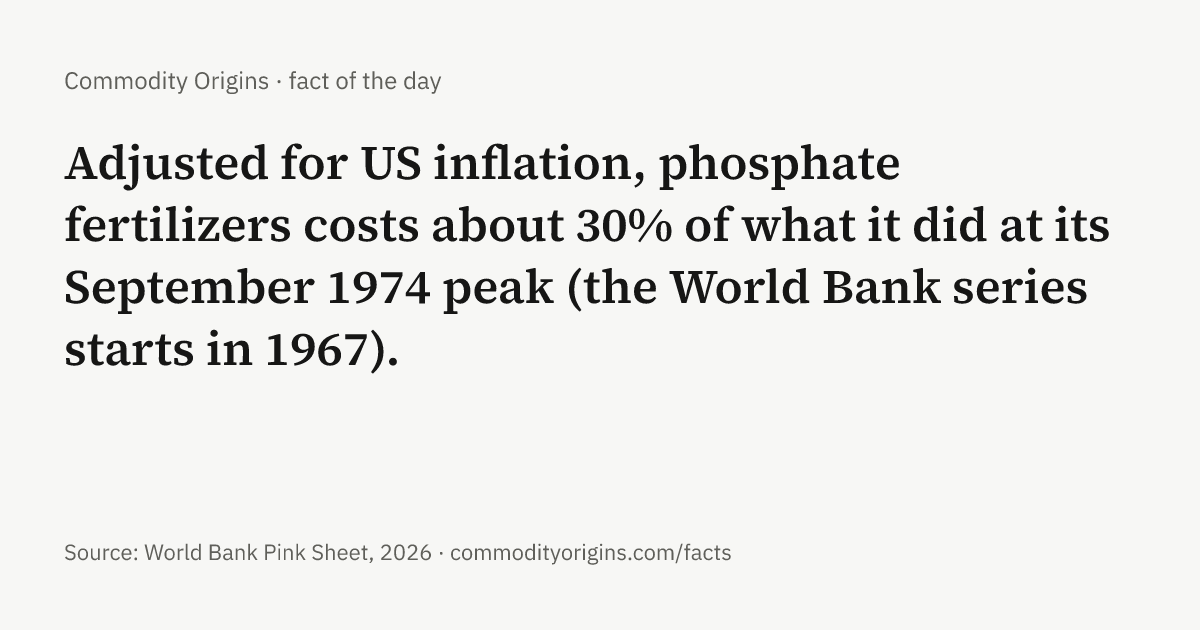
- Adjusted for US inflation, phosphate fertilizers costs about 30% of what it did at its September 1974 peak (the World Bank series starts in 1967). Source: World Bank Pink Sheet, 2026. Phosphate fertilizers · Phosphate fertilizers prices · # · image
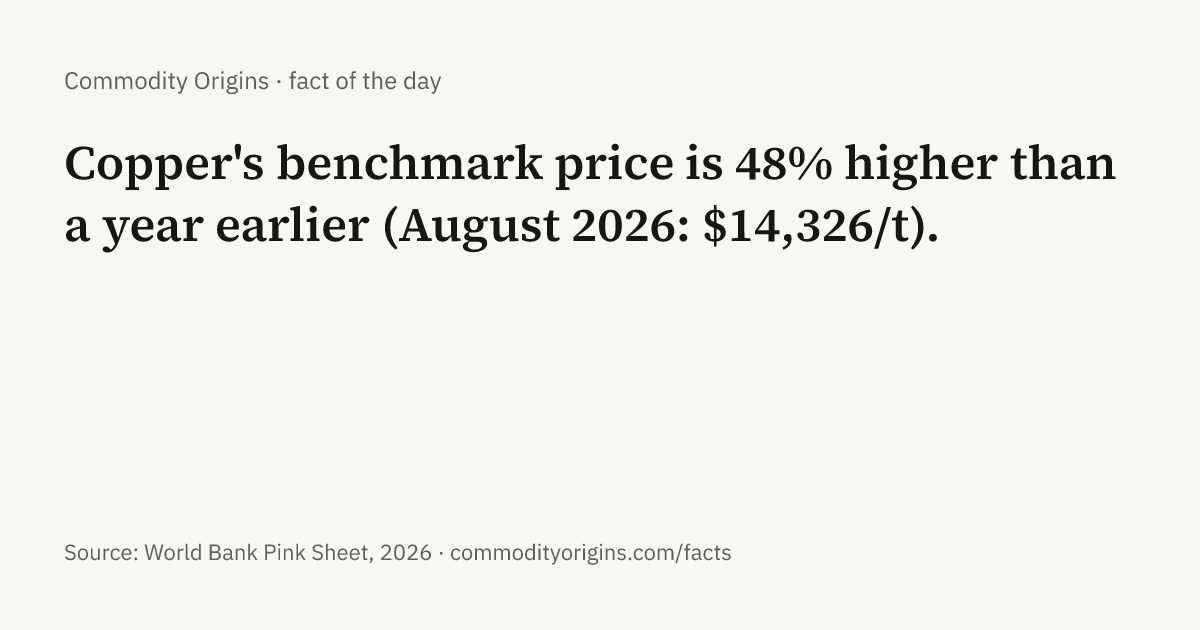
- Copper's benchmark price is 48% higher than a year earlier (August 2026: $14,326/t). Source: World Bank Pink Sheet, 2026. Copper · Copper prices · # · image
- Adjusted for US inflation, coconut oil costs about 21% of what it did at its March 1974 peak (the World Bank series starts in 1960). Source: World Bank Pink Sheet, 2026. Coconut oil · Coconut oil prices · # · image
- Tin's benchmark price is 6.5 times what it was twenty years ago in nominal dollars ($55,385/t in August 2026). Source: World Bank Pink Sheet, 2026. Tin · Tin prices · # · image
- Adjusted for US inflation, sugar costs about 5% of what it did at its November 1974 peak (the World Bank series starts in 1960). Source: World Bank Pink Sheet, 2026. Sugar · Sugar prices · # · image
- Adjusted for US inflation, phosphate rock costs about 21% of what it did at its February 1977 peak (the World Bank series starts in 1960). Source: World Bank Pink Sheet, 2026. Phosphate rock · Phosphate rock prices · # · image
- Fishmeal's benchmark price reached $2,500/t in August 2026, the highest monthly average in the World Bank series that starts in 1979. Adjusted for inflation it is still 10% below its January 2013 peak. Source: World Bank Pink Sheet, 2026. Fishmeal · Fishmeal prices · # · image
- Cocoa's benchmark price rose 140% in the five years to August 2026 ($5.95/kg now). Source: World Bank Pink Sheet, 2026. Cocoa · Cocoa prices · # · image
- Silver's benchmark price rose 173% in the five years to August 2026 ($65.4/troy oz now). Source: World Bank Pink Sheet, 2026. Silver · Silver prices · # · image
- Tin's benchmark price reached $55,385/t in August 2026, the highest monthly average in the World Bank series that starts in 1960. Adjusted for inflation it is still 27% below its October 1978 peak. Source: World Bank Pink Sheet, 2026. Tin · Tin prices · # · image
- Copper's benchmark price reached $14,326/t in August 2026, the highest monthly average in the World Bank series that starts in 1960. Adjusted for inflation it is still 32% below its April 1974 peak. Source: World Bank Pink Sheet, 2026. Copper · Copper prices · # · image
- Adjusted for US inflation, coffee costs about 20% of what it did at its April 1977 peak (the World Bank series starts in 1960). Source: World Bank Pink Sheet, 2026. Coffee · Coffee prices · # · image
- Aluminum's benchmark price reached $3,666/t in May 2026, the highest monthly average in the World Bank series that starts in 1960. Adjusted for inflation it is still 68% below its June 1988 peak. Source: World Bank Pink Sheet, 2026. Aluminum · Aluminum prices · # · image
- Gold's benchmark price rose 147% in the five years to August 2026 ($4,411/troy oz now). Source: World Bank Pink Sheet, 2026. Gold · Gold prices · # · image
- Silver's benchmark price is 71% higher than a year earlier (August 2026: $65.4/troy oz). Source: World Bank Pink Sheet, 2026. Silver · Silver prices · # · image
Price ratios
- Platinum cost 40% of the price of gold in August 2026. The last month in which platinum cost more than gold was December 2014. Source: World Bank Pink Sheet, 2026. Platinum prices · Gold prices · # · image
- A tonne of copper cost 3.25 ounces of gold in August 2026, against an average of 10.47 ounces since 1960. Source: World Bank Pink Sheet, 2026. Copper prices · Gold prices · # · image
- In August 2026 one ounce of gold bought 49 barrels of crude oil. Since 1960 the monthly ratio has averaged 20 barrels, with a low of 7 in June 2008 and a high of 72 in April 2020. Source: World Bank Pink Sheet, 2026. Gold prices · Crude oil prices · # · image
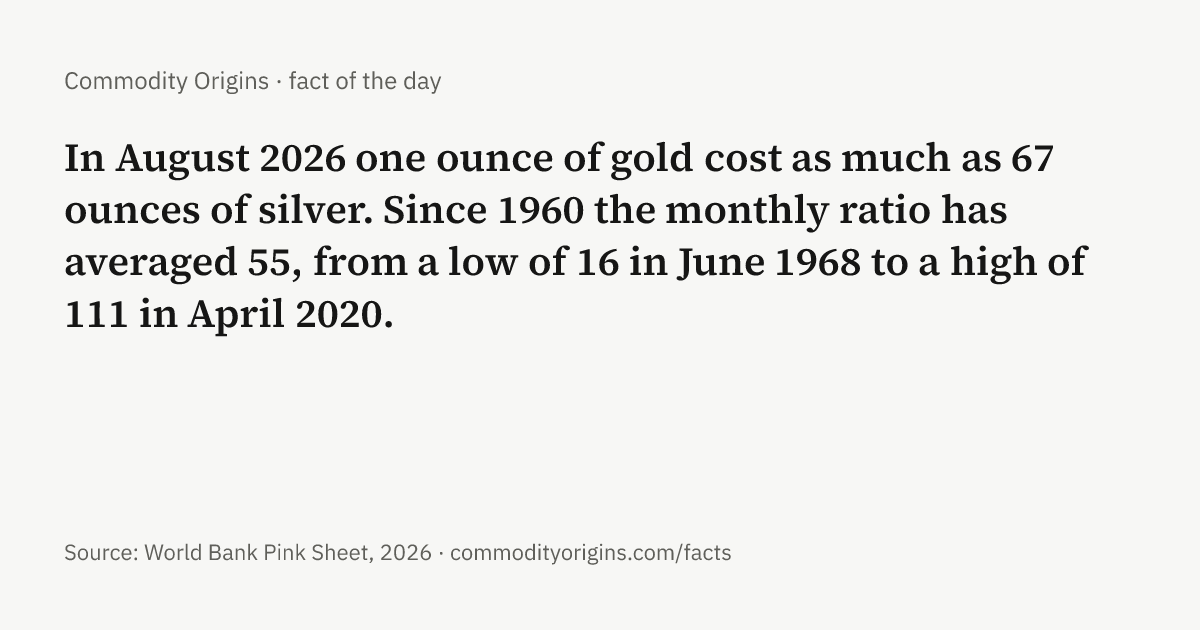
- In August 2026 one ounce of gold cost as much as 67 ounces of silver. Since 1960 the monthly ratio has averaged 55, from a low of 16 in June 1968 to a high of 111 in April 2020. Source: World Bank Pink Sheet, 2026. Gold prices · Silver prices · # · image
Prices that move together
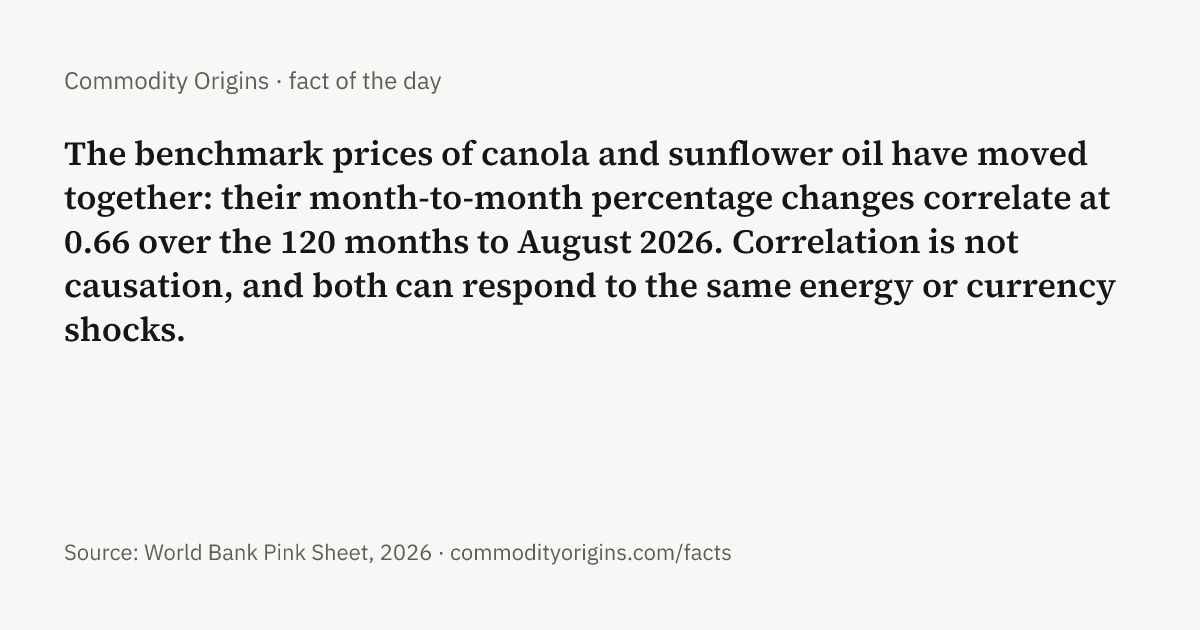
- The benchmark prices of canola and sunflower oil have moved together: their month-to-month percentage changes correlate at 0.66 over the 120 months to August 2026. Correlation is not causation, and both can respond to the same energy or currency shocks. Source: World Bank Pink Sheet, 2026. Canola prices · Sunflower oil prices · # · image
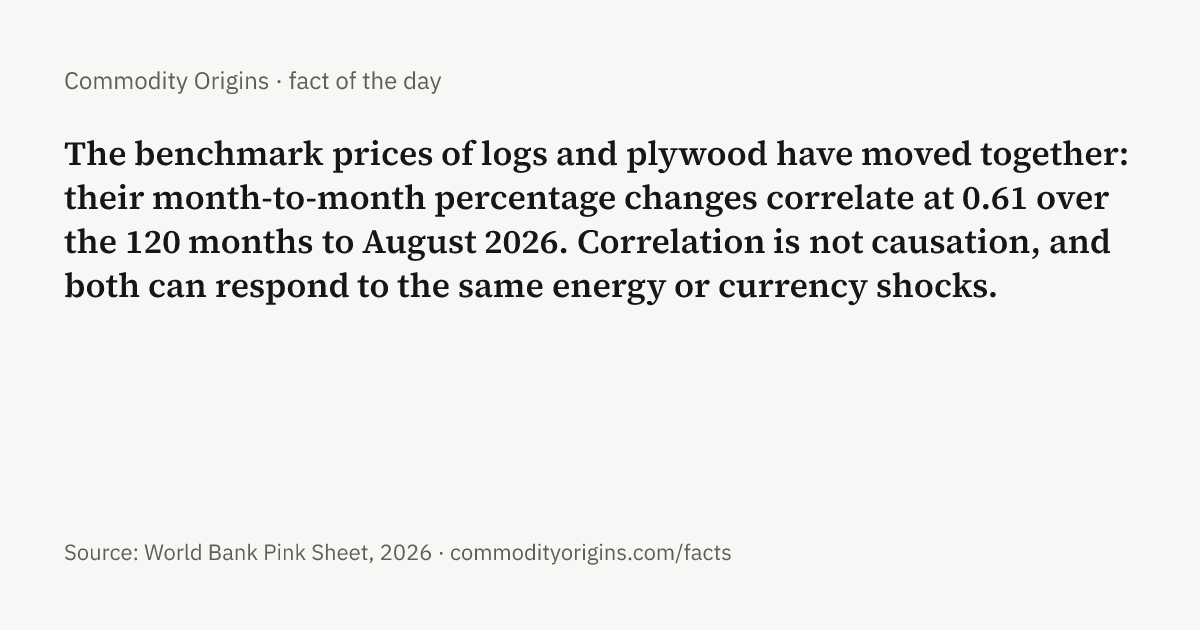
- The benchmark prices of logs and plywood have moved together: their month-to-month percentage changes correlate at 0.61 over the 120 months to August 2026. Correlation is not causation, and both can respond to the same energy or currency shocks. Source: World Bank Pink Sheet, 2026. Logs prices · Plywood prices · # · image
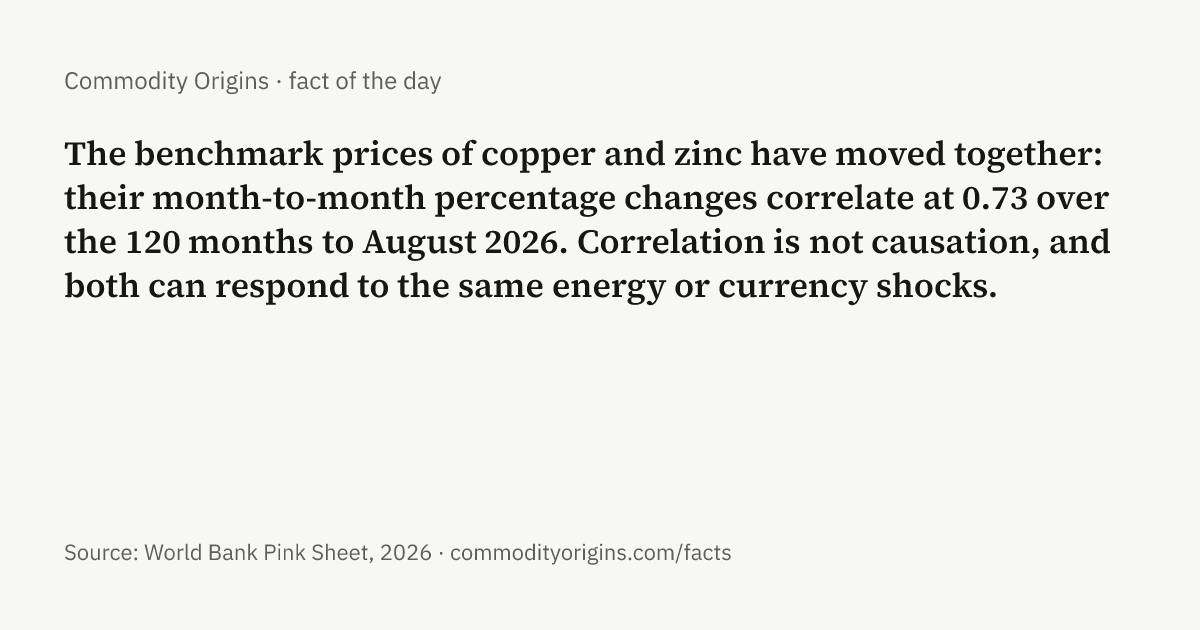
- The benchmark prices of copper and zinc have moved together: their month-to-month percentage changes correlate at 0.73 over the 120 months to August 2026. Correlation is not causation, and both can respond to the same energy or currency shocks. Source: World Bank Pink Sheet, 2026. Copper prices · Zinc prices · # · image
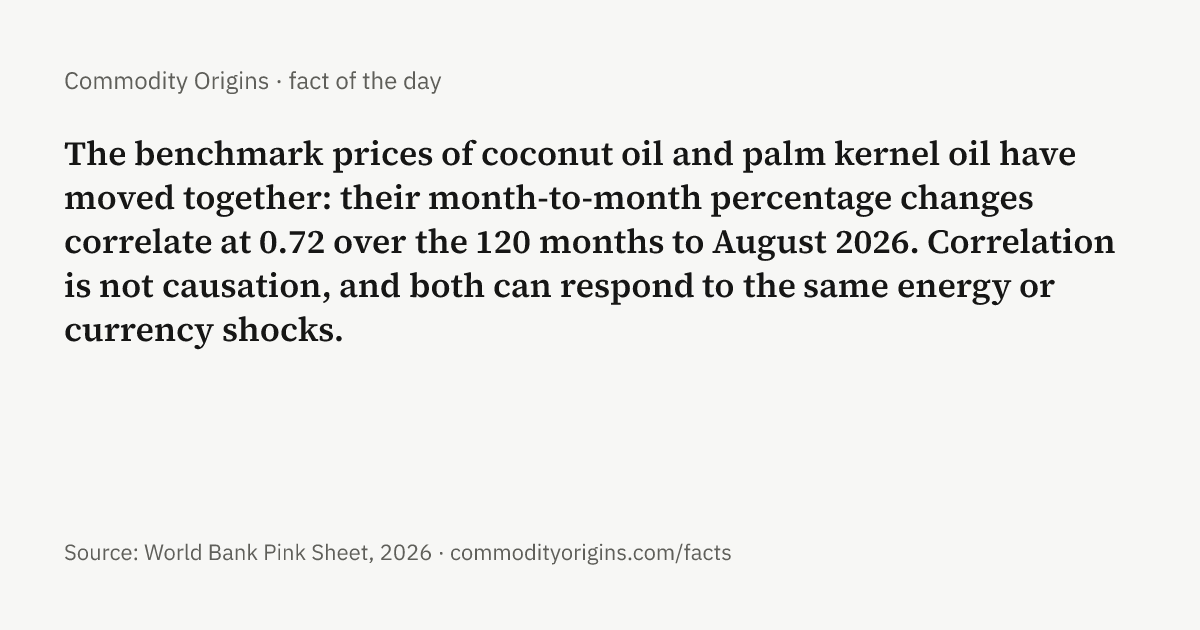
- The benchmark prices of coconut oil and palm kernel oil have moved together: their month-to-month percentage changes correlate at 0.72 over the 120 months to August 2026. Correlation is not causation, and both can respond to the same energy or currency shocks. Source: World Bank Pink Sheet, 2026. Coconut oil prices · Palm kernel oil prices · # · image
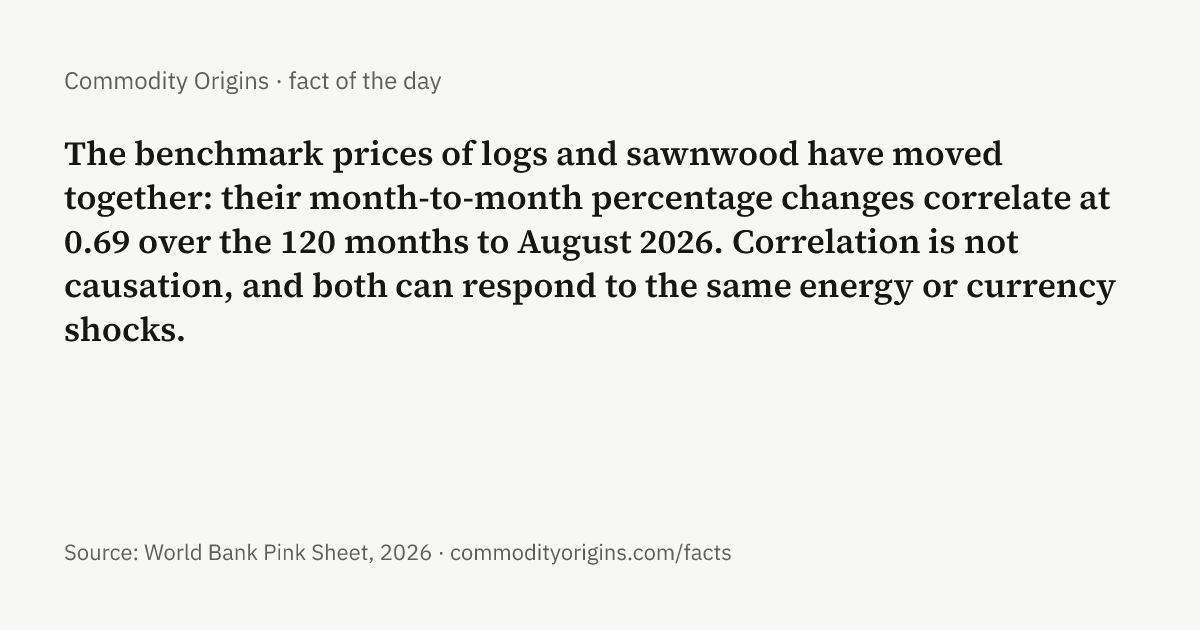
- The benchmark prices of logs and sawnwood have moved together: their month-to-month percentage changes correlate at 0.69 over the 120 months to August 2026. Correlation is not causation, and both can respond to the same energy or currency shocks. Source: World Bank Pink Sheet, 2026. Logs prices · Sawnwood prices · # · image
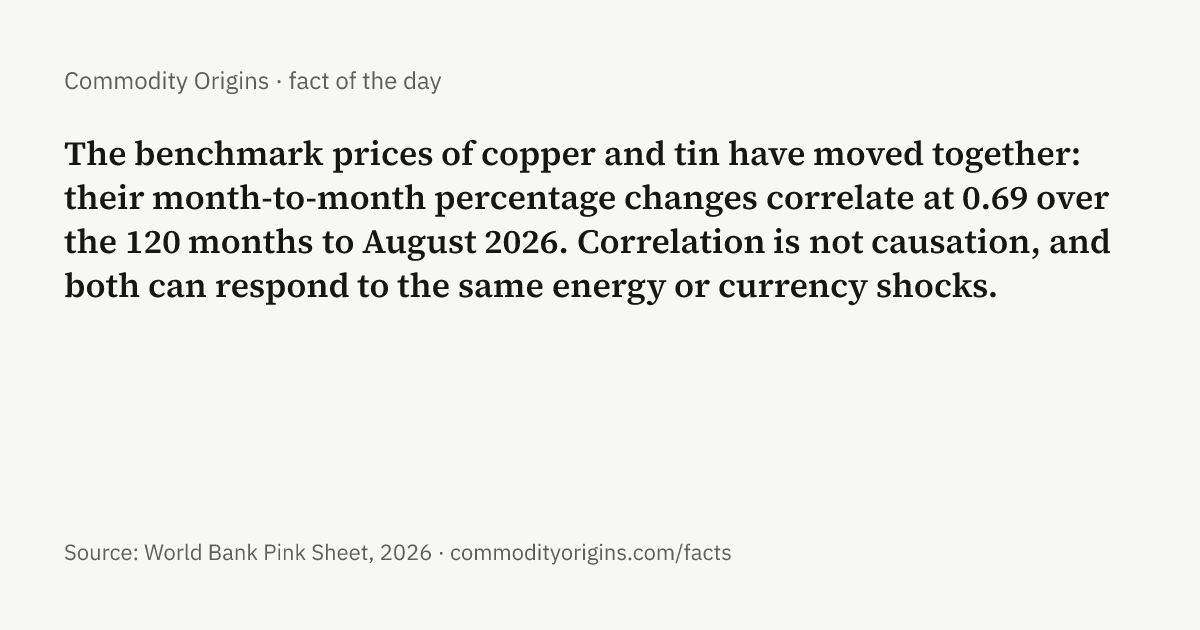
- The benchmark prices of copper and tin have moved together: their month-to-month percentage changes correlate at 0.69 over the 120 months to August 2026. Correlation is not causation, and both can respond to the same energy or currency shocks. Source: World Bank Pink Sheet, 2026. Copper prices · Tin prices · # · image
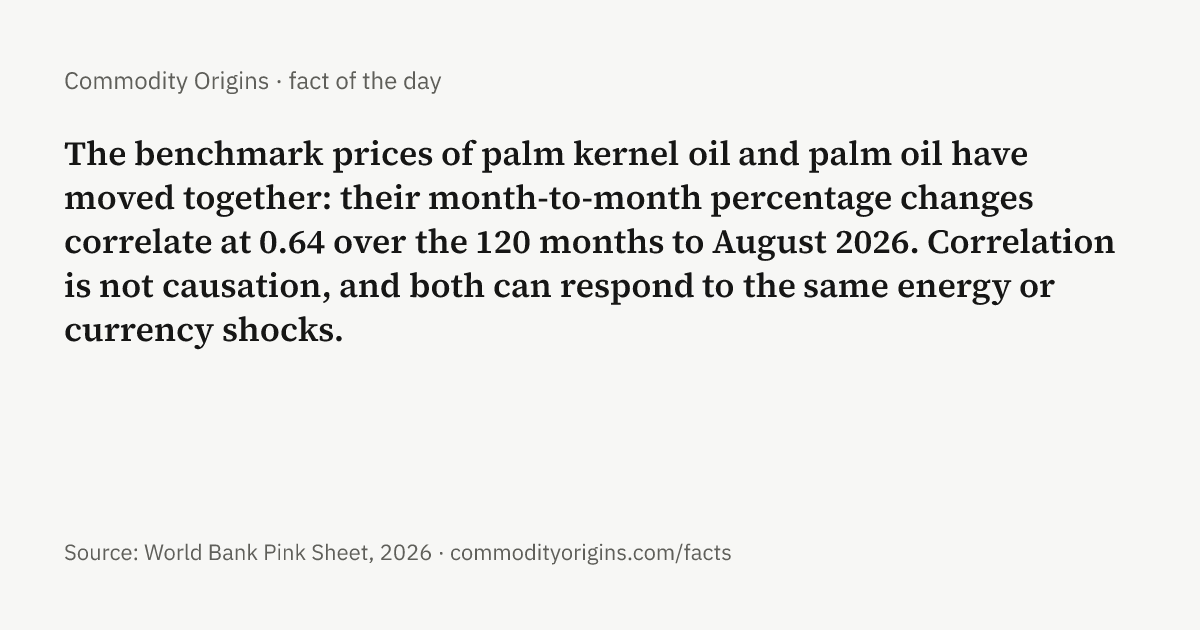
- The benchmark prices of palm kernel oil and palm oil have moved together: their month-to-month percentage changes correlate at 0.64 over the 120 months to August 2026. Correlation is not causation, and both can respond to the same energy or currency shocks. Source: World Bank Pink Sheet, 2026. Palm kernel oil prices · Palm oil prices · # · image
- The benchmark prices of platinum and silver have moved together: their month-to-month percentage changes correlate at 0.80 over the 120 months to August 2026. Correlation is not causation, and both can respond to the same energy or currency shocks. Source: World Bank Pink Sheet, 2026. Platinum prices · Silver prices · # · image
- The benchmark prices of gold and silver have moved together: their month-to-month percentage changes correlate at 0.72 over the 120 months to August 2026. Correlation is not causation, and both can respond to the same energy or currency shocks. Source: World Bank Pink Sheet, 2026. Gold prices · Silver prices · # · image
- The benchmark prices of aluminum and copper have moved together: their month-to-month percentage changes correlate at 0.61 over the 120 months to August 2026. Correlation is not causation, and both can respond to the same energy or currency shocks. Source: World Bank Pink Sheet, 2026. Aluminum prices · Copper prices · # · image
Seasonal patterns
- Measured against each surrounding year, the benchmark price of bananas has on average been highest in March and lowest in November over 2000 to 2025, a gap of about 15%. March was above November in 26 of 26 years. The highest and lowest months are picked after the fact, so this describes the past and is not a forecast. Source: World Bank Pink Sheet, 2025. Bananas · Bananas prices · # · image
- Measured against each surrounding year, the benchmark price of palm kernel oil has on average been highest in February and lowest in October over 2000 to 2025, a gap of about 11%. February was above October in 20 of 26 years. The highest and lowest months are picked after the fact, so this describes the past and is not a forecast. Source: World Bank Pink Sheet, 2025. Palm kernel oil · Palm kernel oil prices · # · image
- Measured against each surrounding year, the benchmark price of tin has on average been highest in April and lowest in November over 2000 to 2025, a gap of about 8%. April was above November in 20 of 26 years. The highest and lowest months are picked after the fact, so this describes the past and is not a forecast. Source: World Bank Pink Sheet, 2025. Tin · Tin prices · # · image
- Measured against each surrounding year, the benchmark price of tea has on average been highest in July and lowest in March over 2000 to 2025, a gap of about 14%. July was above March in 25 of 26 years. The highest and lowest months are picked after the fact, so this describes the past and is not a forecast. Source: World Bank Pink Sheet, 2025. Tea · Tea prices · # · image
- Measured against each surrounding year, the benchmark price of iron ore has on average been highest in February and lowest in November over 2000 to 2025, a gap of about 11%. February was above November in 23 of 26 years. The highest and lowest months are picked after the fact, so this describes the past and is not a forecast. Source: World Bank Pink Sheet, 2025. Iron ore · Iron ore prices · # · image
Trade
- India bought 42% of world imports of jute (HS 5303) by value in 2024. Source: CEPII BACI, 2024. Jute · India · # · image
- China supplied 42% of world exports of natural graphite (HS 2504) by value in 2024. Source: CEPII BACI, 2024. Graphite · China · # · image
- Indonesia supplied 46% of world exports of cloves (HS 090711) by value in 2024. Source: CEPII BACI, 2024. Cloves · Indonesia · # · image
- The United States supplied 72% of world exports of pistachios (HS 080251) by value in 2024. Source: CEPII BACI, 2024. Pistachios · United States · # · image
- Spain supplied 42% of world exports of olive oil (HS 1509) by value in 2024. Source: CEPII BACI, 2024. Olive oil · Spain · # · image
- Brazil supplied 47% of world exports of sugar (HS 1701) by value in 2024. Source: CEPII BACI, 2024. Sugar · Brazil · # · image
- The Netherlands bought 28% of world imports of orange juice (HS 200919 and 200911) by value in 2024. Source: CEPII BACI, 2024. Orange juice · Netherlands · # · image
- South Africa supplied 85% of world exports of chromium ore (HS 2610) by value in 2024. Source: CEPII BACI, 2024. Chromium · South Africa · # · image
- Namibia supplied 68% of world exports of uranium ores and concentrates (HS 261210) by value in 2024. Source: CEPII BACI, 2024. Uranium · Namibia · # · image
- China bought 32% of world imports of frozen beef (HS 0202) by value in 2024. Source: CEPII BACI, 2024. Beef · China · # · image
- India bought 33% of world imports of cloves (HS 090711) by value in 2024. Source: CEPII BACI, 2024. Cloves · India · # · image
- The United States bought 30% of world imports of oats (HS 1004) by value in 2024. Source: CEPII BACI, 2024. Oats · United States · # · image
- Brazil supplied 48% of world exports of orange juice (HS 200919 and 200911) by value in 2024. Source: CEPII BACI, 2024. Orange juice · Brazil · # · image
- The United States supplied 58% of world exports of grain sorghum (HS 1007) by value in 2024. Source: CEPII BACI, 2024. Sorghum · United States · # · image
- Brazil bought 32% of world imports of phosphatic fertilizers (HS 3103) by value in 2024. Source: CEPII BACI, 2024. Phosphate fertilizers · Brazil · # · image
- China bought 60% of world imports of manganese ore (HS 2602) by value in 2024. Source: CEPII BACI, 2024. Manganese · China · # · image
- Madagascar supplied 60% of world exports of vanilla (HS 0905) by value in 2024. Source: CEPII BACI, 2024. Vanilla · Madagascar · # · image
- China bought 28% of world imports of linseed (HS 1204) by value in 2024. Source: CEPII BACI, 2024. Linseed · China · # · image
- China bought 51% of world imports of uranium ores and concentrates (HS 261210) by value in 2024. Source: CEPII BACI, 2024. Uranium · China · # · image
- China bought 34% of world imports of barley (HS 1003) by value in 2024. Source: CEPII BACI, 2024. Barley · China · # · image
- China bought 35% of world imports of fish and meat meal (HS 2301) by value in 2024. Source: CEPII BACI, 2024. Fishmeal · China · # · image
- China bought 71% of world imports of iron ore (HS 2601) by value in 2024. Source: CEPII BACI, 2024. Iron ore · China · # · image
- China bought 65% of world imports of chromium ore (HS 2610) by value in 2024. Source: CEPII BACI, 2024. Chromium · China · # · image
- Peru supplied 46% of world exports of quinoa (HS 100850) by value in 2024. Source: CEPII BACI, 2024. Quinoa · Peru · # · image
- Mexico supplied 43% of world exports of avocados (HS 080440) by value in 2024. Source: CEPII BACI, 2024. Avocados · Mexico · # · image
- China bought 41% of world imports of wood in the rough (HS 4403) by value in 2024. Source: CEPII BACI, 2024. Logs · China · # · image
- Norway supplied 50% of world exports of fresh Atlantic salmon (HS 030214) by value in 2024. Source: CEPII BACI, 2024. Salmon · Norway · # · image
- Indonesia supplied 48% of world exports of palm oil (HS 1511) by value in 2024. Source: CEPII BACI, 2024. Palm oil · Indonesia · # · image
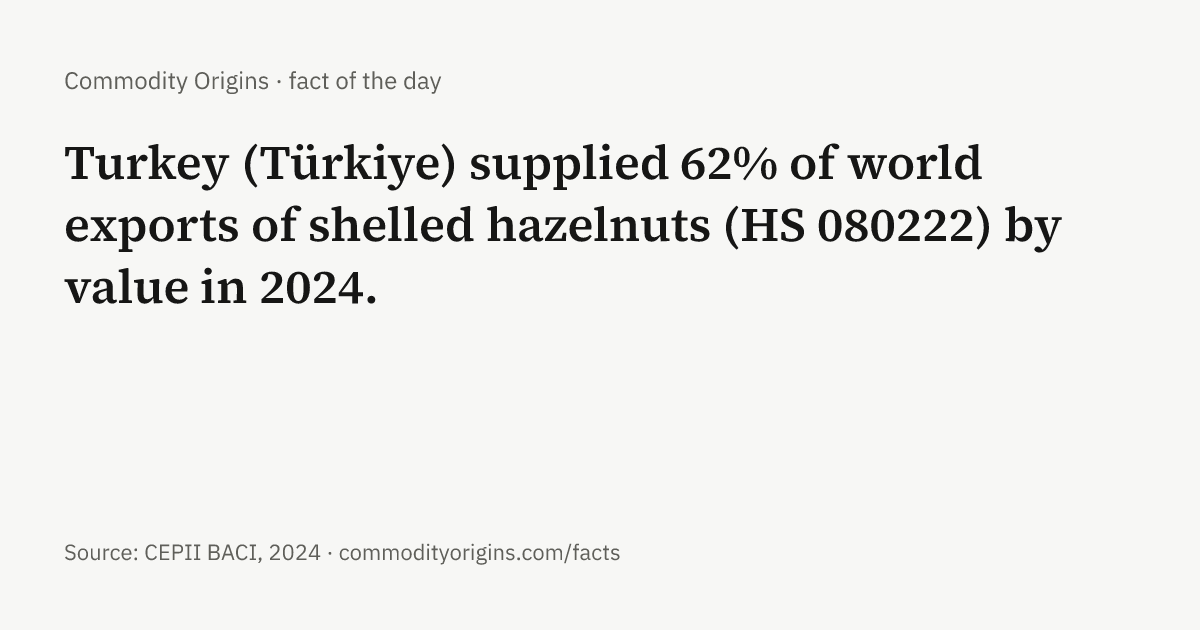
- Turkey (Türkiye) supplied 62% of world exports of shelled hazelnuts (HS 080222) by value in 2024. Source: CEPII BACI, 2024. Hazelnuts · Turkey (Türkiye) · # · image
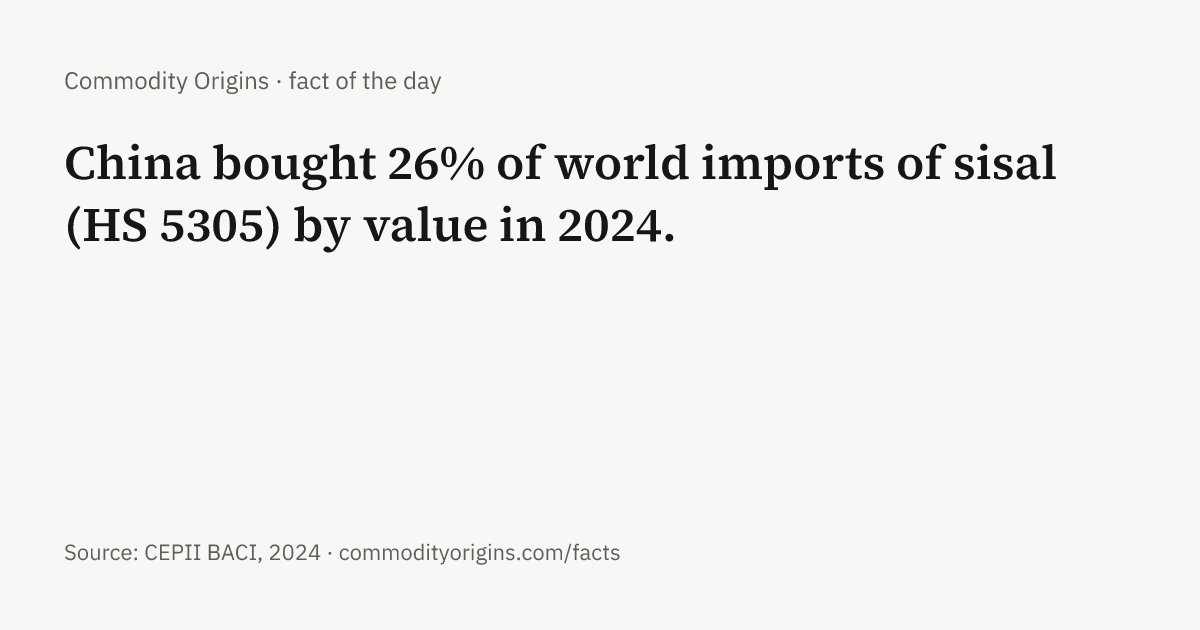
- China bought 26% of world imports of sisal (HS 5305) by value in 2024. Source: CEPII BACI, 2024. Sisal · China · # · image
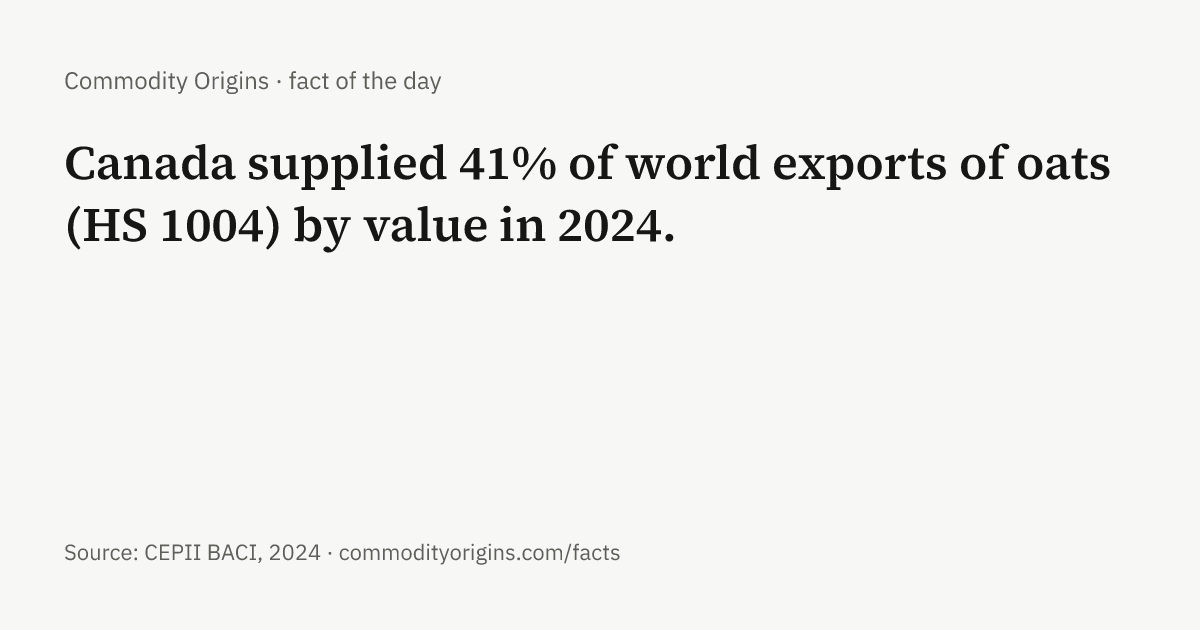
- Canada supplied 41% of world exports of oats (HS 1004) by value in 2024. Source: CEPII BACI, 2024. Oats · Canada · # · image
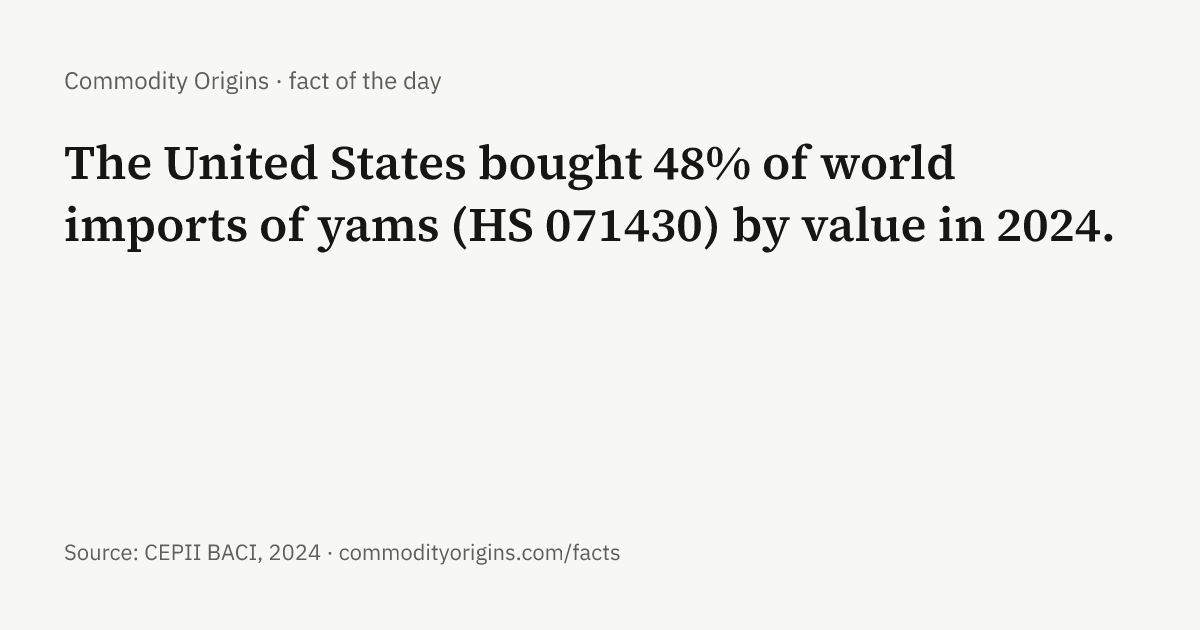
- The United States bought 48% of world imports of yams (HS 071430) by value in 2024. Source: CEPII BACI, 2024. Yams · United States · # · image
- The United States bought 30% of world imports of vanilla (HS 0905) by value in 2024. Source: CEPII BACI, 2024. Vanilla · United States · # · image
- The United States bought 33% of world imports of plantains (HS 080310) by value in 2024. Source: CEPII BACI, 2024. Plantains · United States · # · image
- China bought 86% of world imports of bauxite (HS 2606) by value in 2024. Source: CEPII BACI, 2024. Bauxite · China · # · image
- Brazil supplied 54% of world exports of soybeans (HS 1201) by value in 2024. Source: CEPII BACI, 2024. Soybeans · Brazil · # · image
- China bought 26% of world imports of pistachios (HS 080251) by value in 2024. Source: CEPII BACI, 2024. Pistachios · China · # · image
- The United States bought 35% of world imports of quinoa (HS 100850) by value in 2024. Source: CEPII BACI, 2024. Quinoa · United States · # · image
- Costa Rica supplied 59% of world exports of pineapples (HS 080430) by value in 2024. Source: CEPII BACI, 2024. Pineapples · Costa Rica · # · image
- China bought 68% of world imports of unwrought cobalt and mattes (HS 810520) by value in 2024. Source: CEPII BACI, 2024. Cobalt · China · # · image
- Chile supplied 73% of world exports of lithium carbonate (HS 283691) by value in 2024. Source: CEPII BACI, 2024. Lithium · Chile · # · image
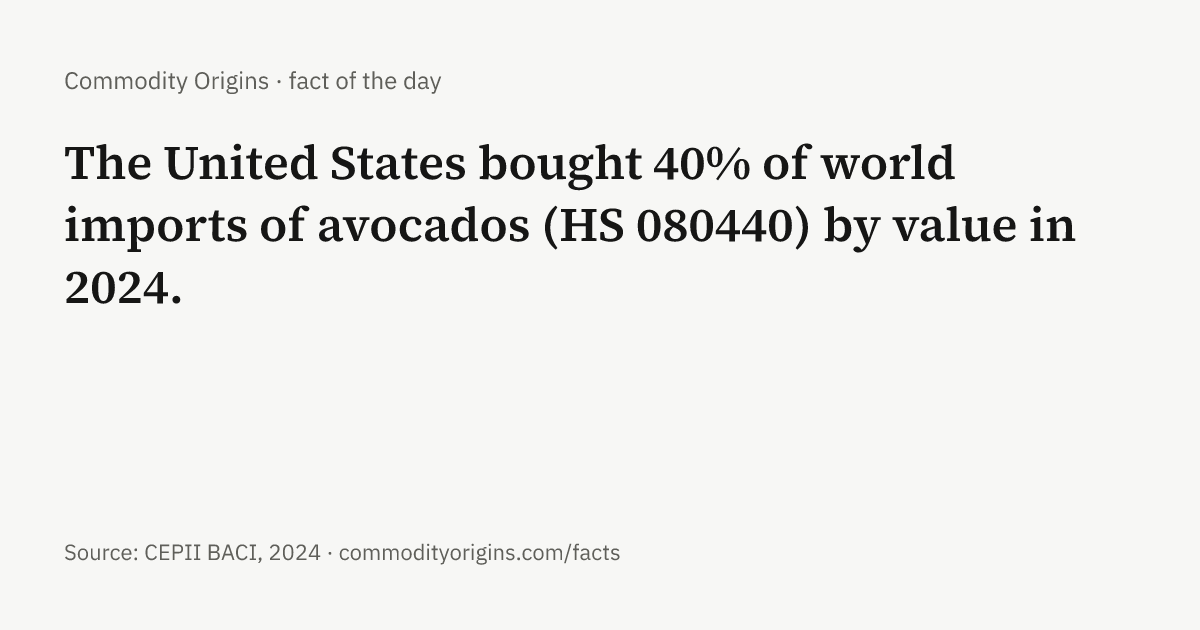
- The United States bought 40% of world imports of avocados (HS 080440) by value in 2024. Source: CEPII BACI, 2024. Avocados · United States · # · image
- Australia supplied 62% of world exports of greasy and scoured wool (HS 5101) by value in 2024. Source: CEPII BACI, 2024. Wool · Australia · # · image
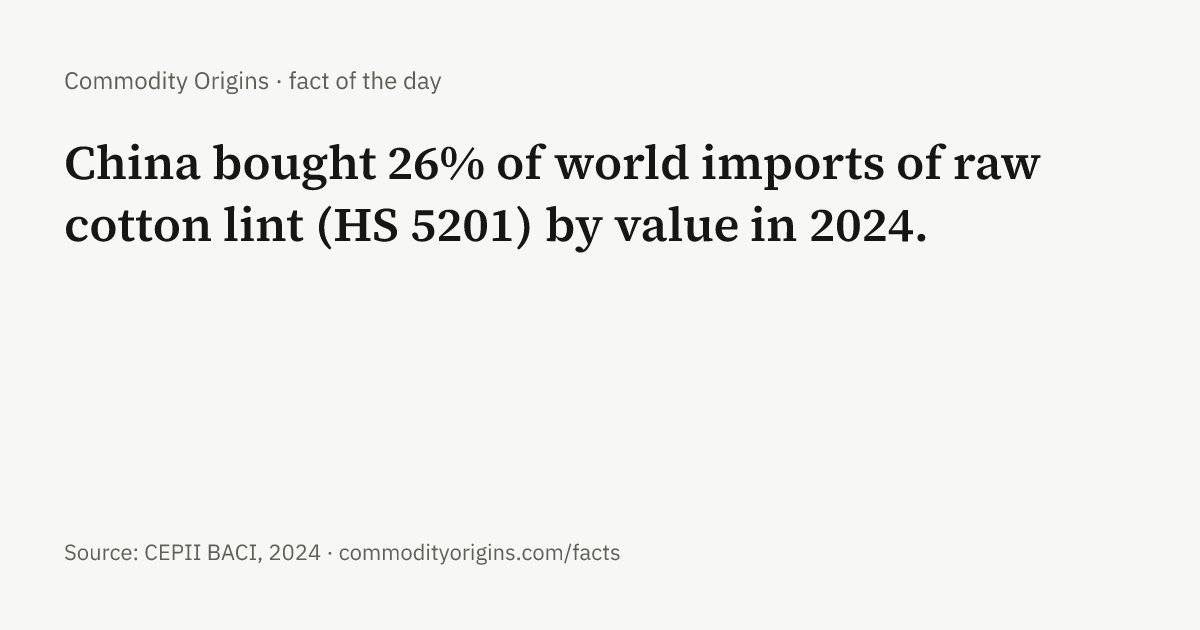
- China bought 26% of world imports of raw cotton lint (HS 5201) by value in 2024. Source: CEPII BACI, 2024. Cotton · China · # · image
- China supplied 56% of world exports of ginger (HS 091011) by value in 2024. Source: CEPII BACI, 2024. Ginger · China · # · image
- Guatemala supplied 41% of world exports of cardamom (HS 0908) by value in 2024. Source: CEPII BACI, 2024. Cardamom · Guatemala · # · image
- Vietnam bought 51% of world imports of raw cashew nuts in shell (HS 080131) by value in 2024. Source: CEPII BACI, 2024. Cashews · Vietnam · # · image
- The United States bought 32% of world imports of pineapples (HS 080430) by value in 2024. Source: CEPII BACI, 2024. Pineapples · United States · # · image
- Australia supplied 55% of world exports of iron ore (HS 2601) by value in 2024. Source: CEPII BACI, 2024. Iron ore · Australia · # · image
- Bangladesh supplied 69% of world exports of jute (HS 5303) by value in 2024. Source: CEPII BACI, 2024. Jute · Bangladesh · # · image
- China bought 71% of world imports of greasy and scoured wool (HS 5101) by value in 2024. Source: CEPII BACI, 2024. Wool · China · # · image
- The United States bought 32% of world imports of tomatoes (HS 0702) by value in 2024. Source: CEPII BACI, 2024. Tomatoes · United States · # · image
- Australia supplied 42% of world exports of sheep and goat meat (HS 0204) by value in 2024. Source: CEPII BACI, 2024. Lamb · Australia · # · image
- China bought 63% of world imports of copper ores and concentrates (HS 2603) by value in 2024. Source: CEPII BACI, 2024. Copper · China · # · image
- China supplied 48% of world exports of silk (HS 5002) by value in 2024. Source: CEPII BACI, 2024. Silk · China · # · image
- China bought 81% of world imports of grain sorghum (HS 1007) by value in 2024. Source: CEPII BACI, 2024. Sorghum · China · # · image
- Guinea supplied 72% of world exports of bauxite (HS 2606) by value in 2024. Source: CEPII BACI, 2024. Bauxite · Guinea · # · image
- DR Congo (Democratic Republic of the Congo) supplied 65% of world exports of unwrought cobalt and mattes (HS 810520) by value in 2024. Source: CEPII BACI, 2024. Cobalt · DR Congo (Democratic Republic of the Congo) · # · image
- Morocco supplied 42% of world exports of phosphatic fertilizers (HS 3103) by value in 2024. Source: CEPII BACI, 2024. Phosphate fertilizers · Morocco · # · image
- China bought 27% of world imports of crustaceans (HS 0306) by value in 2024. Source: CEPII BACI, 2024. Shrimp · China · # · image
- India bought 36% of world imports of phosphate rock (HS 2510) by value in 2024. Source: CEPII BACI, 2024. Phosphate rock · India · # · image
- China bought 27% of world imports of sesame seed (HS 1207) by value in 2024. Source: CEPII BACI, 2024. Sesame seed · China · # · image
- South Africa supplied 49% of world exports of manganese ore (HS 2602) by value in 2024. Source: CEPII BACI, 2024. Manganese · South Africa · # · image
- India bought 32% of world imports of silk (HS 5002) by value in 2024. Source: CEPII BACI, 2024. Silk · India · # · image
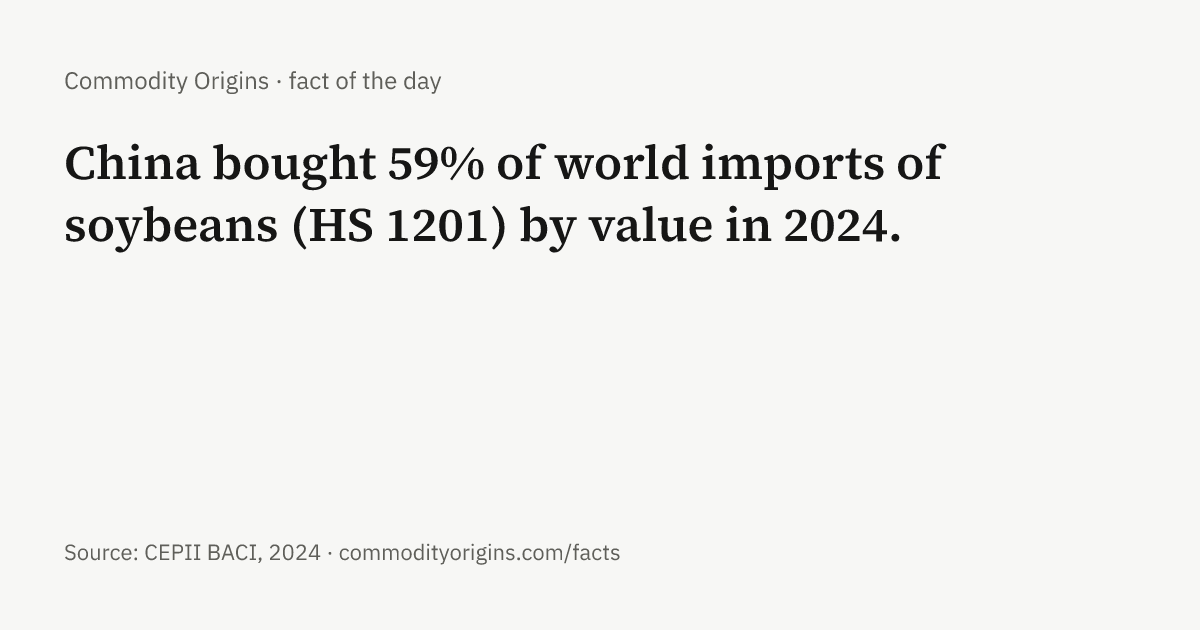
- China bought 59% of world imports of soybeans (HS 1201) by value in 2024. Source: CEPII BACI, 2024. Soybeans · China · # · image
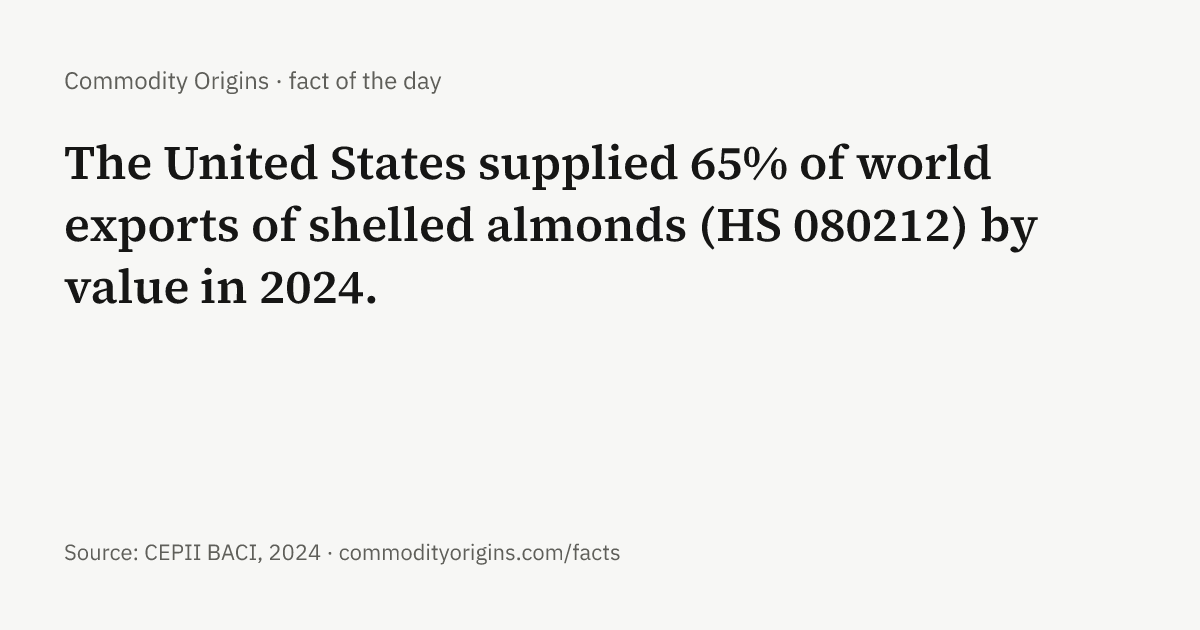
- The United States supplied 65% of world exports of shelled almonds (HS 080212) by value in 2024. Source: CEPII BACI, 2024. Almonds · United States · # · image
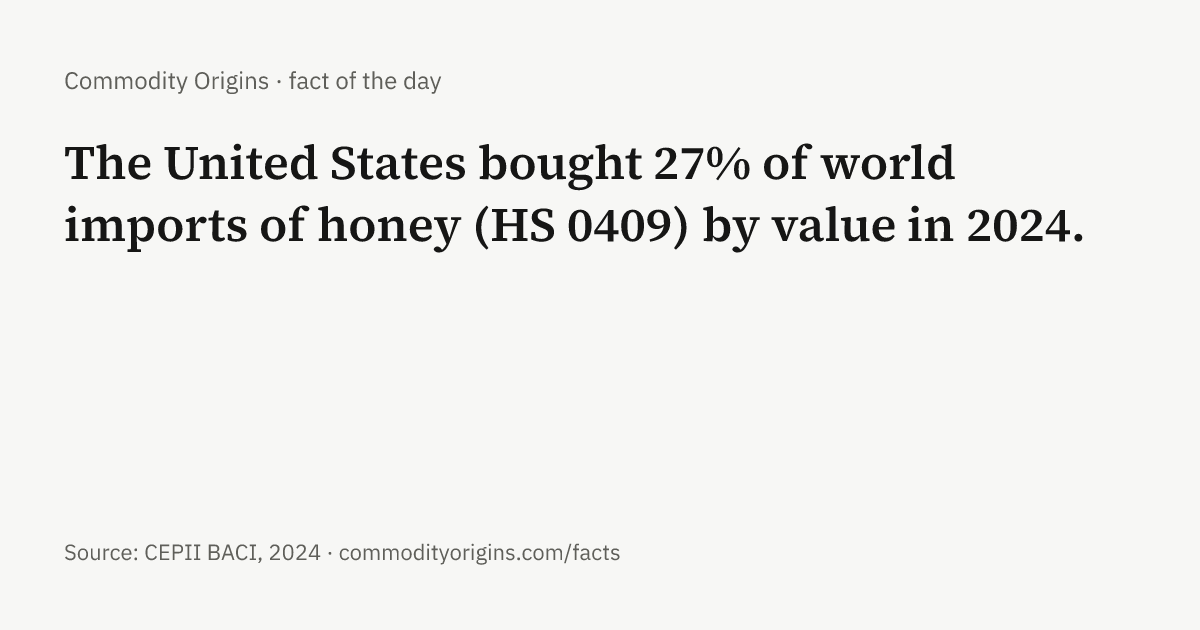
- The United States bought 27% of world imports of honey (HS 0409) by value in 2024. Source: CEPII BACI, 2024. Honey · United States · # · image
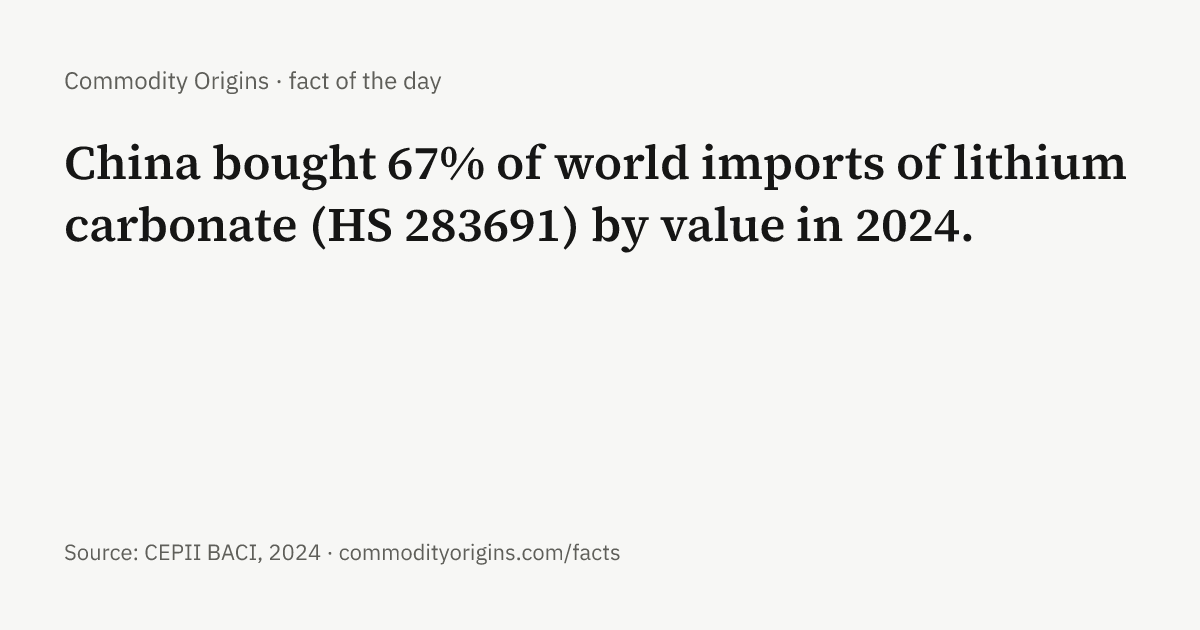
- China bought 67% of world imports of lithium carbonate (HS 283691) by value in 2024. Source: CEPII BACI, 2024. Lithium · China · # · image
Reserves
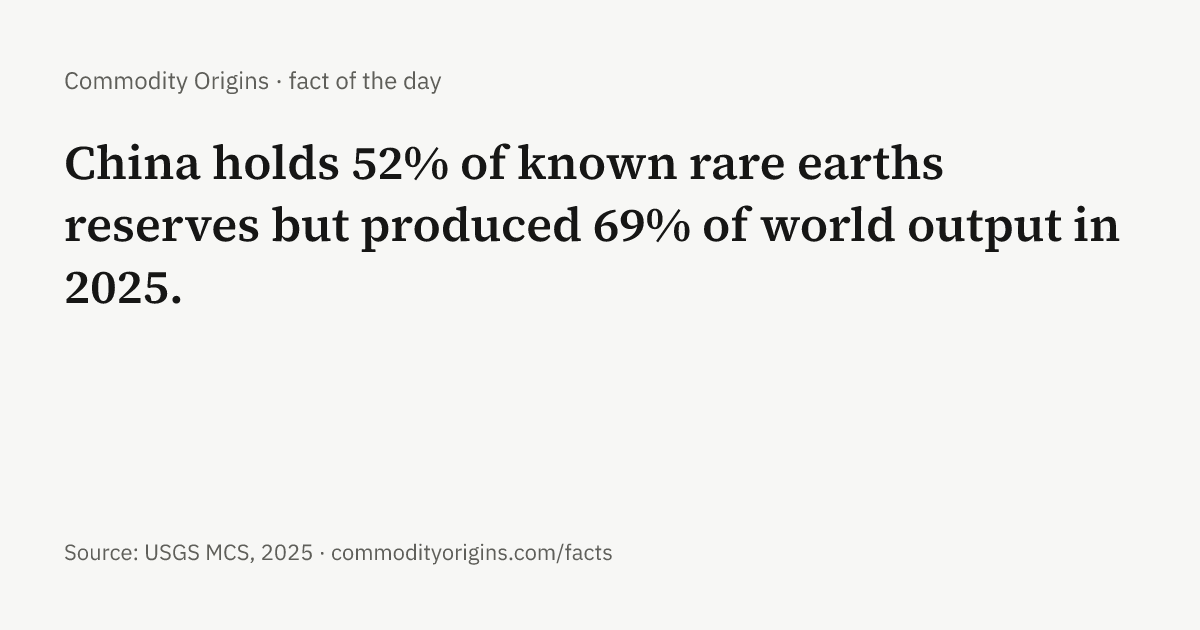
- China holds 52% of known rare earths reserves but produced 69% of world output in 2025. Source: USGS MCS, 2025. Rare earths · China · # · image
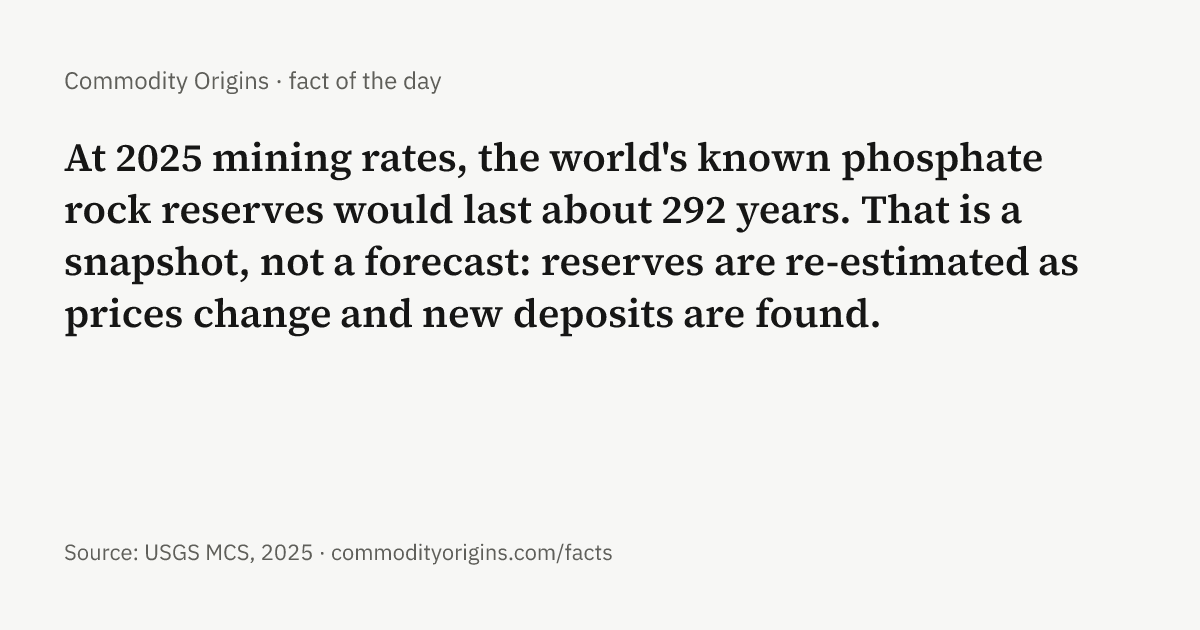
- At 2025 mining rates, the world's known phosphate rock reserves would last about 292 years. That is a snapshot, not a forecast: reserves are re-estimated as prices change and new deposits are found. Source: USGS MCS, 2025. Phosphate rock · # · image
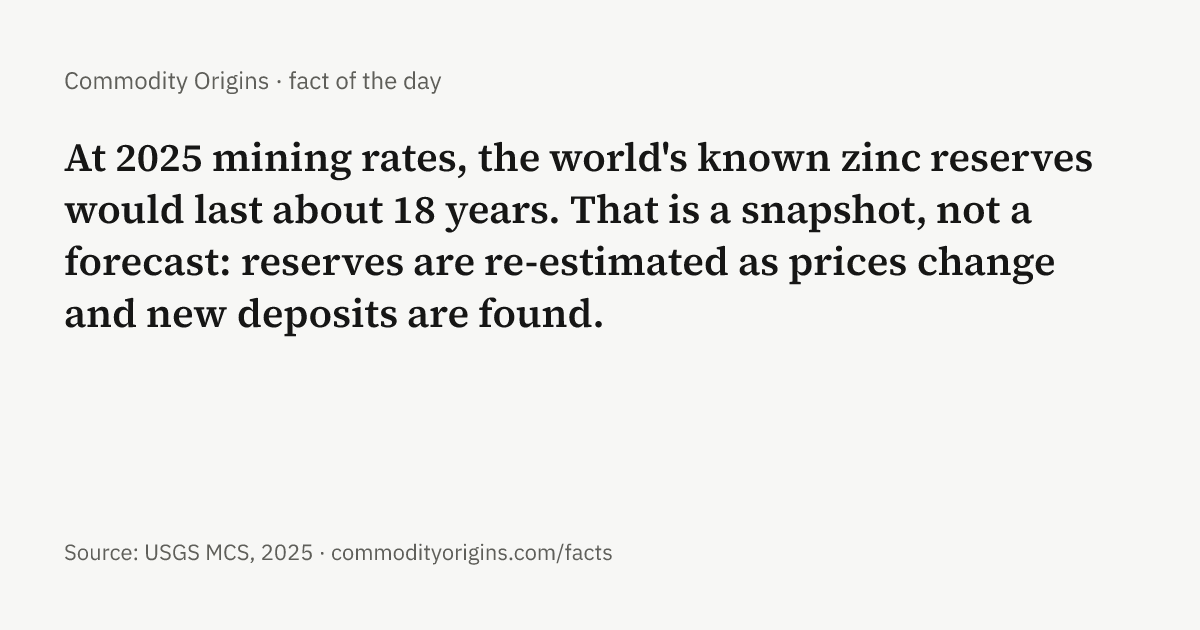
- At 2025 mining rates, the world's known zinc reserves would last about 18 years. That is a snapshot, not a forecast: reserves are re-estimated as prices change and new deposits are found. Source: USGS MCS, 2025. Zinc · # · image
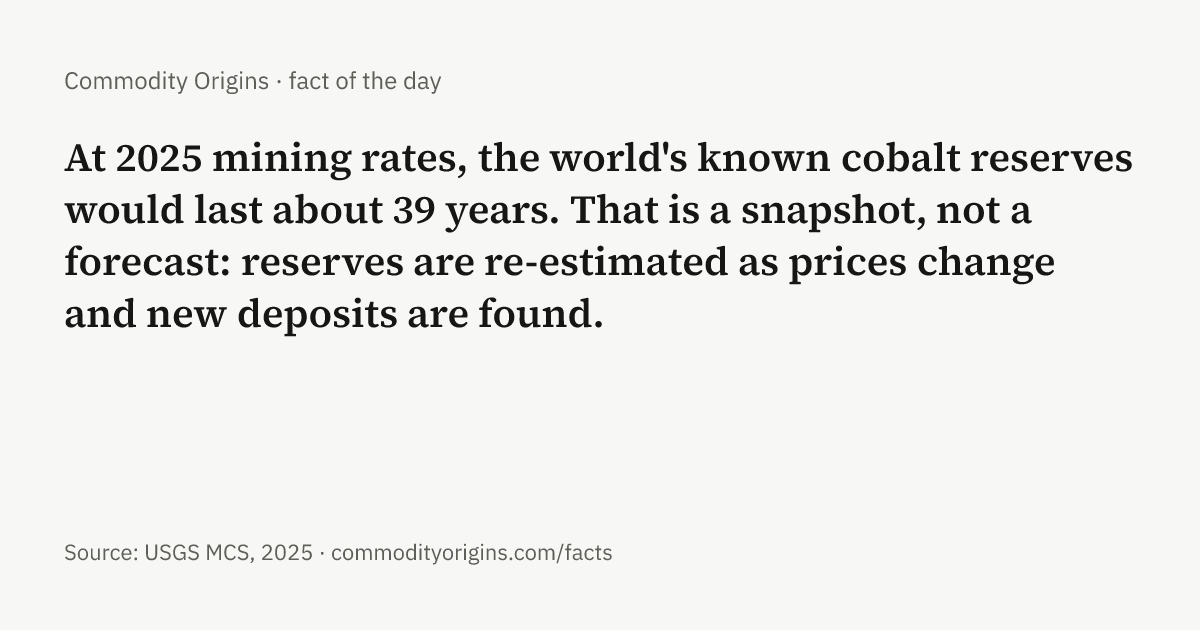
- At 2025 mining rates, the world's known cobalt reserves would last about 39 years. That is a snapshot, not a forecast: reserves are re-estimated as prices change and new deposits are found. Source: USGS MCS, 2025. Cobalt · # · image
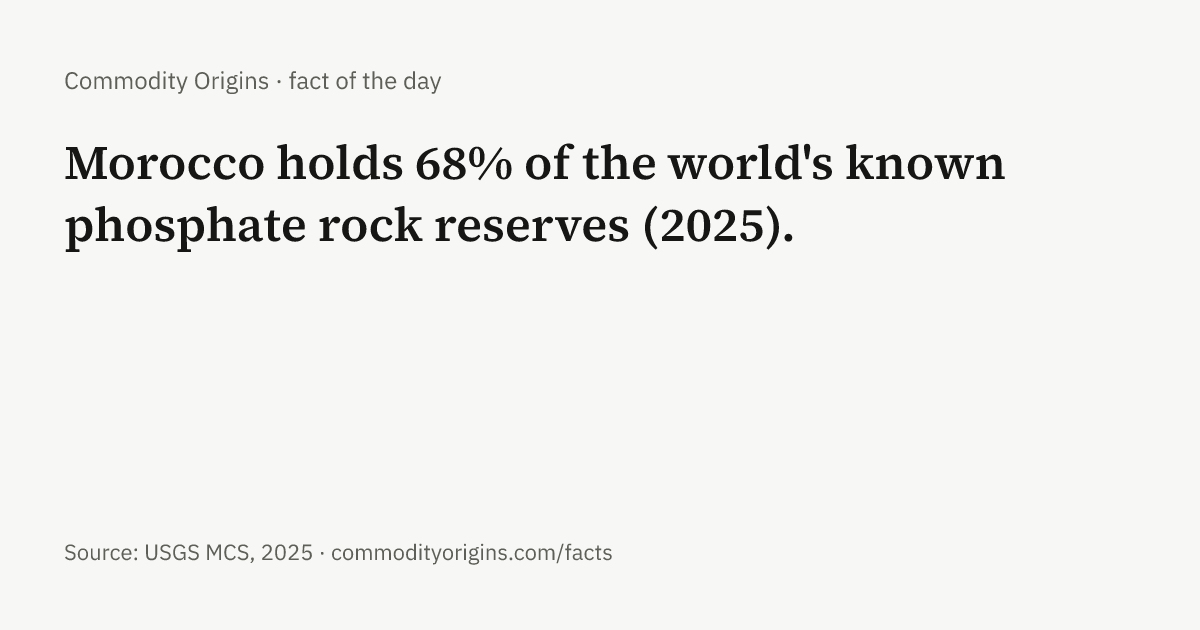
- Morocco holds 68% of the world's known phosphate rock reserves (2025). Source: USGS MCS, 2025. Phosphate rock · Morocco · # · image
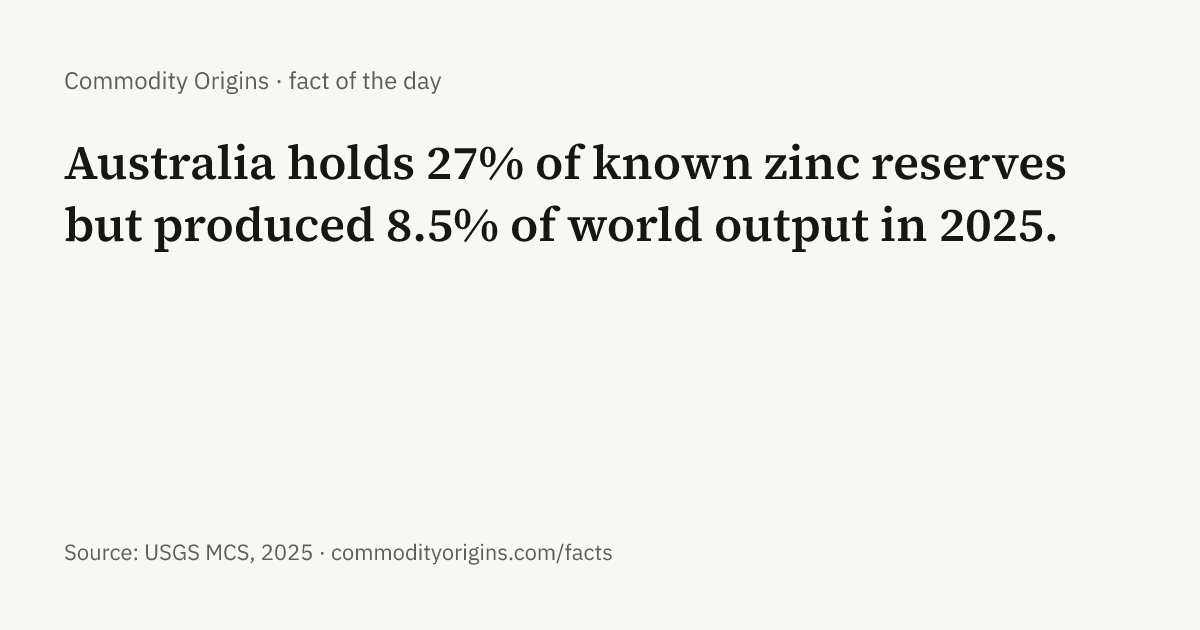
- Australia holds 27% of known zinc reserves but produced 8.5% of world output in 2025. Source: USGS MCS, 2025. Zinc · Australia · # · image
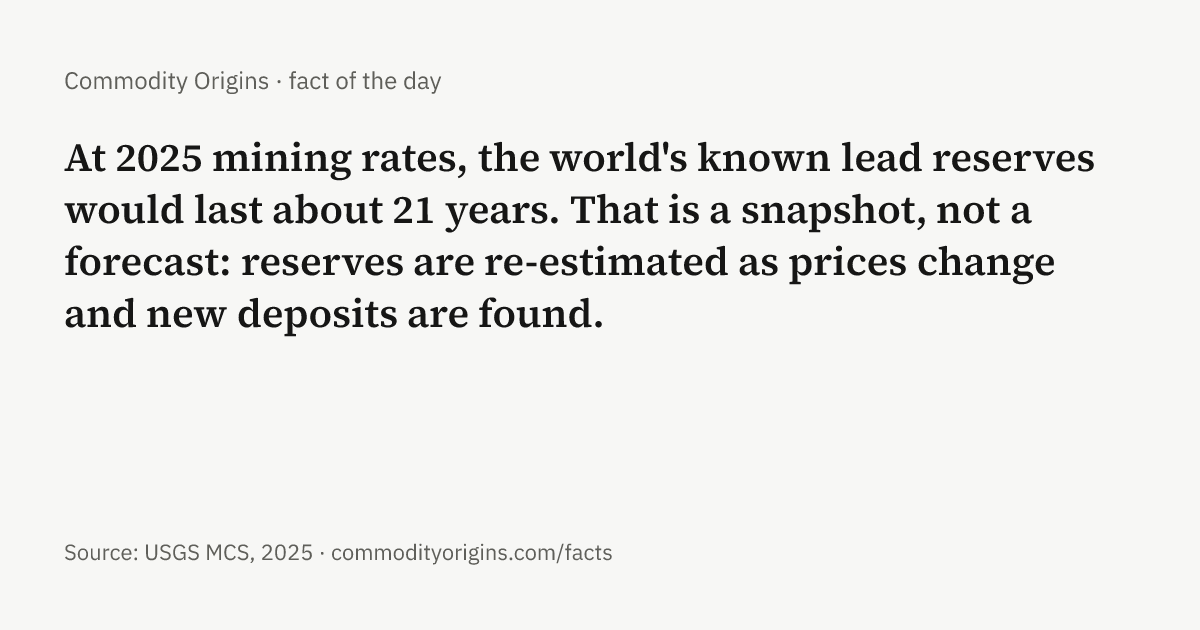
- At 2025 mining rates, the world's known lead reserves would last about 21 years. That is a snapshot, not a forecast: reserves are re-estimated as prices change and new deposits are found. Source: USGS MCS, 2025. Lead · # · image
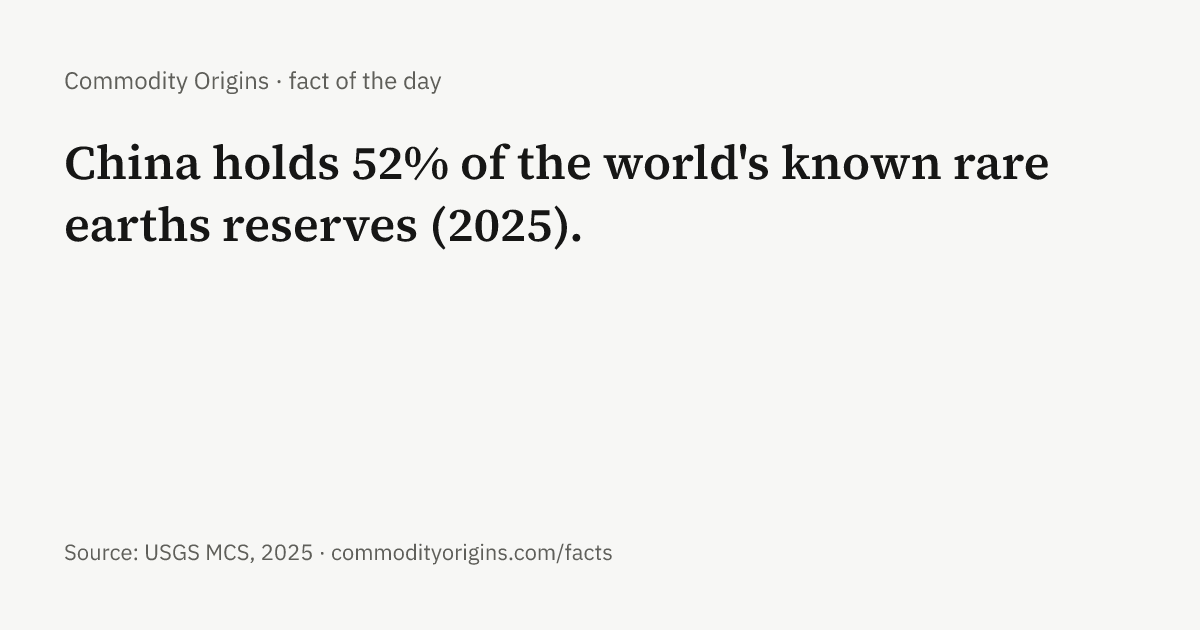
- China holds 52% of the world's known rare earths reserves (2025). Source: USGS MCS, 2025. Rare earths · China · # · image
- At 2025 mining rates, the world's known manganese reserves would last about 85 years. That is a snapshot, not a forecast: reserves are re-estimated as prices change and new deposits are found. Source: USGS MCS, 2025. Manganese · # · image
- Australia holds 34% of known manganese reserves but produced 8% of world output in 2025. Source: USGS MCS, 2025. Manganese · Australia · # · image
- At 2025 mining rates, the world's known rare earths reserves would last about 219 years. That is a snapshot, not a forecast: reserves are re-estimated as prices change and new deposits are found. Source: USGS MCS, 2025. Rare earths · # · image
- At 2025 mining rates, the world's known nickel reserves would last about 33 years. That is a snapshot, not a forecast: reserves are re-estimated as prices change and new deposits are found. Source: USGS MCS, 2025. Nickel · # · image
- Indonesia holds 48% of the world's known nickel reserves (2025). Source: USGS MCS, 2025. Nickel · Indonesia · # · image
- China holds 46% of the world's known molybdenum reserves (2025). Source: USGS MCS, 2025. Molybdenum · China · # · image
- South Africa holds 83% of the world's known platinum reserves (2025). Source: USGS MCS, 2025. Platinum · South Africa · # · image
- At 2025 mining rates, the world's known molybdenum reserves would last about 65 years. That is a snapshot, not a forecast: reserves are re-estimated as prices change and new deposits are found. Source: USGS MCS, 2025. Molybdenum · # · image
- South Africa holds 83% of the world's known palladium reserves (2025). Source: USGS MCS, 2025. Palladium · South Africa · # · image
- DR Congo (Democratic Republic of the Congo) holds 50% of the world's known cobalt reserves (2025). Source: USGS MCS, 2025. Cobalt · DR Congo (Democratic Republic of the Congo) · # · image
- South Africa holds 83% of known palladium reserves but produced 37% of world output in 2025. Source: USGS MCS, 2025. Palladium · South Africa · # · image
- At 2025 mining rates, the world's known graphite reserves would last about 172 years. That is a snapshot, not a forecast: reserves are re-estimated as prices change and new deposits are found. Source: USGS MCS, 2025. Graphite · # · image
- Australia holds 36% of known lead reserves but produced 11% of world output in 2025. Source: USGS MCS, 2025. Lead · Australia · # · image
- At 2025 mining rates, the world's known potash (K2O) reserves would last about 115 years. That is a snapshot, not a forecast: reserves are re-estimated as prices change and new deposits are found. Source: USGS MCS, 2025. Potash · # · image
- Russia holds 36% of known potash (K2O) reserves but produced 20% of world output in 2025. Source: USGS MCS, 2025. Potash · Russia · # · image
- At 2025 mining rates, the world's known silver reserves would last about 23 years. That is a snapshot, not a forecast: reserves are re-estimated as prices change and new deposits are found. Source: USGS MCS, 2025. Silver · # · image
- At 2025 mining rates, the world's known lithium reserves would last about 128 years. That is a snapshot, not a forecast: reserves are re-estimated as prices change and new deposits are found. Source: USGS MCS, 2025. Lithium · # · image
- At 2025 mining rates, the world's known primary aluminum reserves would last about 392 years. That is a snapshot, not a forecast: reserves are re-estimated as prices change and new deposits are found. Source: USGS MCS, 2025. Aluminum · # · image
- Morocco holds 68% of known phosphate rock reserves but produced 14% of world output in 2025. Source: USGS MCS, 2025. Phosphate rock · Morocco · # · image
- At 2025 mining rates, the world's known tin reserves would last about 20 years. That is a snapshot, not a forecast: reserves are re-estimated as prices change and new deposits are found. Source: USGS MCS, 2025. Tin · # · image
- At 2025 mining rates, the world's known bauxite reserves would last about 66 years. That is a snapshot, not a forecast: reserves are re-estimated as prices change and new deposits are found. Source: USGS MCS, 2025. Bauxite · # · image
- At 2025 mining rates, the world's known iron ore reserves would last about 76 years. That is a snapshot, not a forecast: reserves are re-estimated as prices change and new deposits are found. Source: USGS MCS, 2025. Iron ore · # · image
- At 2025 mining rates, the world's known gold reserves would last about 20 years. That is a snapshot, not a forecast: reserves are re-estimated as prices change and new deposits are found. Source: USGS MCS, 2025. Gold · # · image
- At 2025 mining rates, the world's known chromium reserves would last about 18 years. That is a snapshot, not a forecast: reserves are re-estimated as prices change and new deposits are found. Source: USGS MCS, 2024. Chromium · # · image
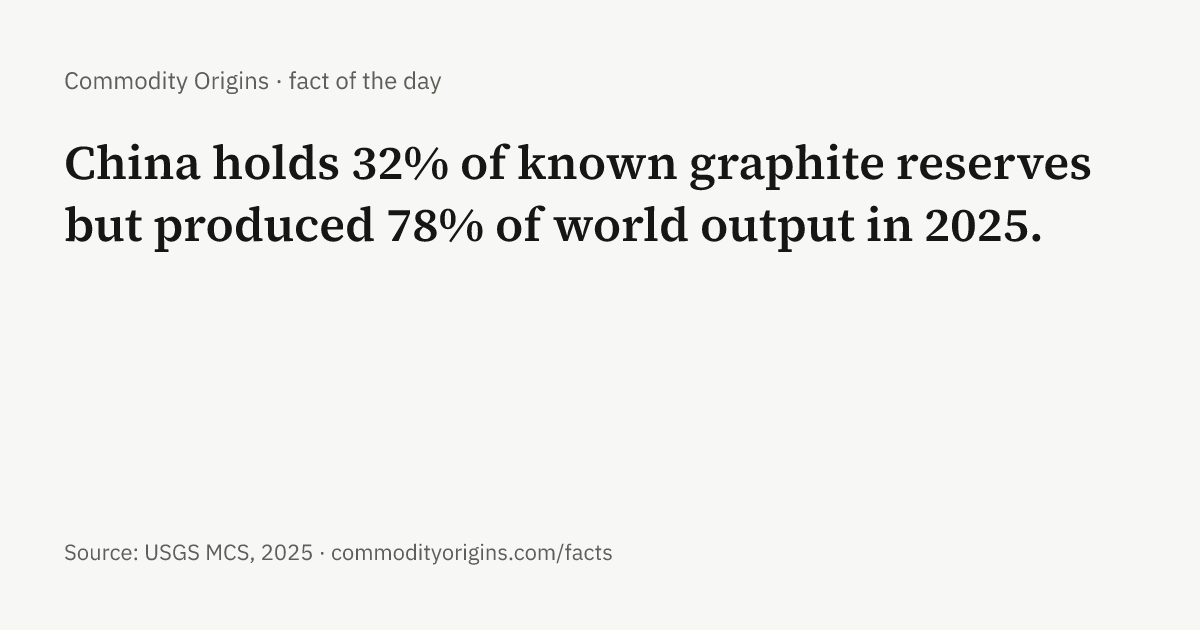
- China holds 32% of known graphite reserves but produced 78% of world output in 2025. Source: USGS MCS, 2025. Graphite · China · # · image
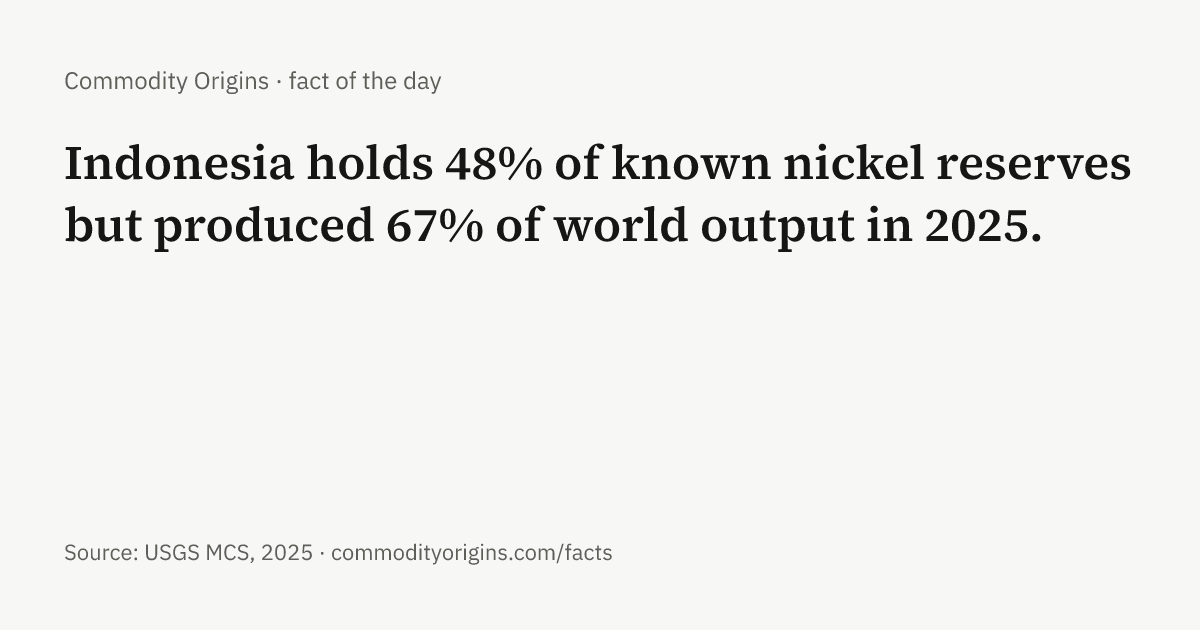
- Indonesia holds 48% of known nickel reserves but produced 67% of world output in 2025. Source: USGS MCS, 2025. Nickel · Indonesia · # · image
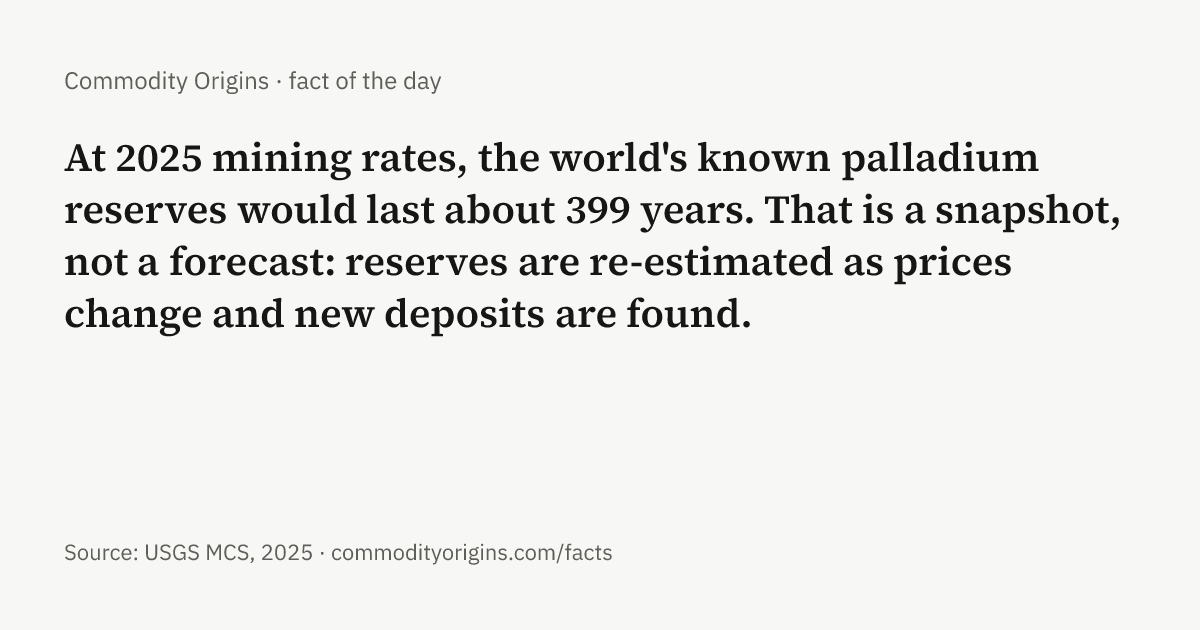
- At 2025 mining rates, the world's known palladium reserves would last about 399 years. That is a snapshot, not a forecast: reserves are re-estimated as prices change and new deposits are found. Source: USGS MCS, 2025. Palladium · # · image
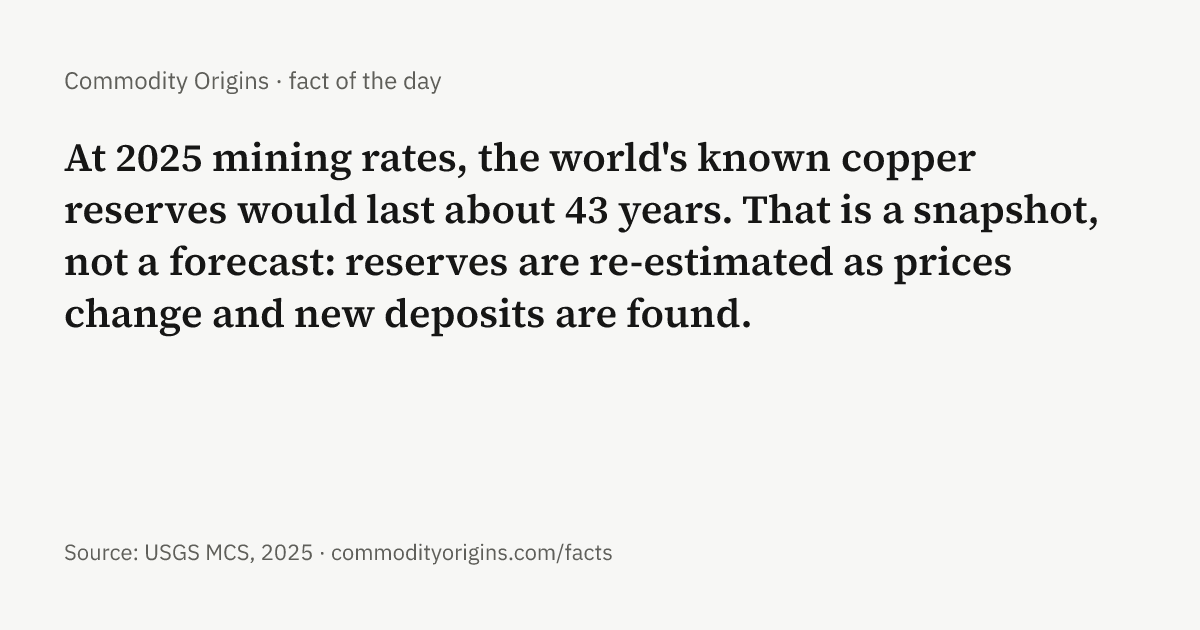
- At 2025 mining rates, the world's known copper reserves would last about 43 years. That is a snapshot, not a forecast: reserves are re-estimated as prices change and new deposits are found. Source: USGS MCS, 2025. Copper · # · image
- DR Congo (Democratic Republic of the Congo) holds 50% of known cobalt reserves but produced 74% of world output in 2025. Source: USGS MCS, 2025. Cobalt · DR Congo (Democratic Republic of the Congo) · # · image
Countries
- China is the largest importer by value of 31 of the 96 commodities with trade data on this site. Source: CEPII BACI, 2024. China · # · image
- India is the largest importer by value of 10 of the 96 commodities with trade data on this site. Source: CEPII BACI, 2024. India · # · image
- China is the world's largest producer of 28 of the 90 commodities with production data on this site, including graphite, rare earths, aluminum, plywood, apples. Source: FAOSTAT, USGS, Energy Institute and FAO FishStat, latest years. China · # · image
- Brazil is among the ten largest producers of 47 of the 90 commodities with production data on this site. Source: FAOSTAT, USGS, Energy Institute and FAO FishStat, latest years. Brazil · # · image
- India is among the ten largest producers of 54 of the 90 commodities with production data on this site. Source: FAOSTAT, USGS, Energy Institute and FAO FishStat, latest years. India · # · image
- China is the largest exporter by value of 8 of the 96 commodities with trade data on this site, including ginger, silk, graphite, rare earths, steel. Source: CEPII BACI, 2024. China · # · image
- India ranks in the top three producers of 33 of the 90 commodities with production data on this site. Source: FAOSTAT, USGS, Energy Institute and FAO FishStat, latest years. India · # · image
- The United States is among the ten largest producers of 49 of the 90 commodities with production data on this site. Source: FAOSTAT, USGS, Energy Institute and FAO FishStat, latest years. United States · # · image
- Australia is the largest exporter by value of 6 of the 96 commodities with trade data on this site, including wool, iron ore, lamb, coal, chickpeas. Source: CEPII BACI, 2024. Australia · # · image
- China is among the ten largest producers of 68 of the 90 commodities with production data on this site. Source: FAOSTAT, USGS, Energy Institute and FAO FishStat, latest years. China · # · image
- The United States ranks in the top three producers of 21 of the 90 commodities with production data on this site. Source: FAOSTAT, USGS, Energy Institute and FAO FishStat, latest years. United States · # · image
- Indonesia ranks in the top three producers of 16 of the 90 commodities with production data on this site. Source: FAOSTAT, USGS, Energy Institute and FAO FishStat, latest years. Indonesia · # · image
- Canada is the world's largest producer of 4 of the 90 commodities with production data on this site, including lentils, potash, canola, oats. Source: FAOSTAT, USGS, Energy Institute and FAO FishStat, latest years. Canada · # · image
- Indonesia is the world's largest producer of 4 of the 90 commodities with production data on this site, including cloves, nickel, palm kernel oil, palm oil. Source: FAOSTAT, USGS, Energy Institute and FAO FishStat, latest years. Indonesia · # · image
- The United States is the largest importer by value of 25 of the 96 commodities with trade data on this site. Source: CEPII BACI, 2024. United States · # · image
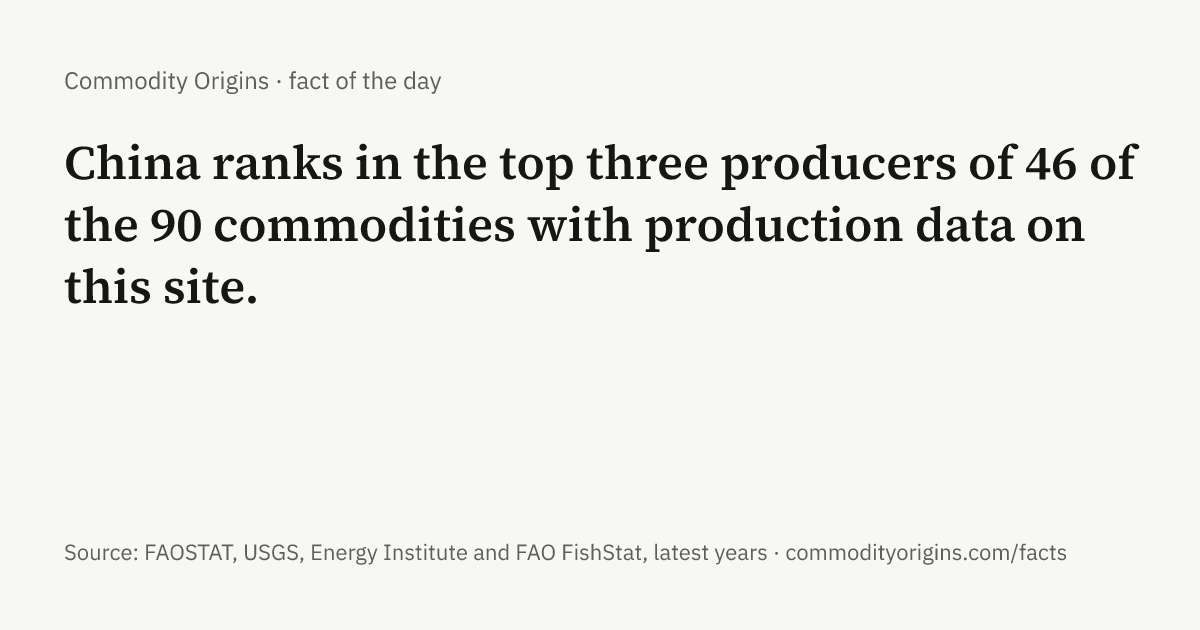
- China ranks in the top three producers of 46 of the 90 commodities with production data on this site. Source: FAOSTAT, USGS, Energy Institute and FAO FishStat, latest years. China · # · image
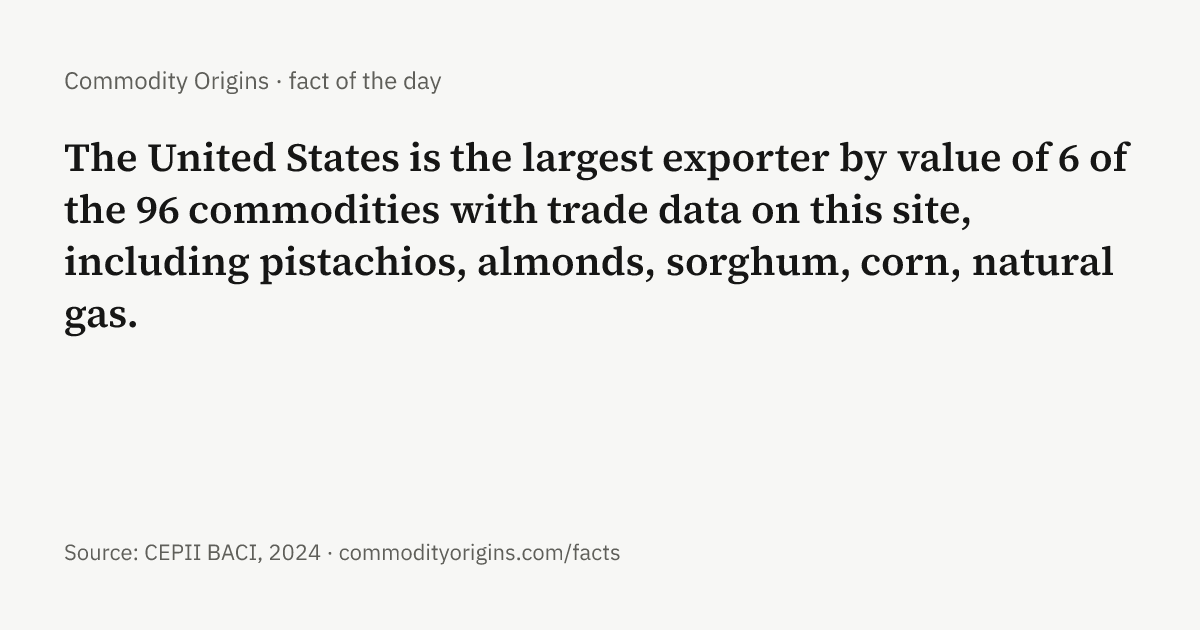
- The United States is the largest exporter by value of 6 of the 96 commodities with trade data on this site, including pistachios, almonds, sorghum, corn, natural gas. Source: CEPII BACI, 2024. United States · # · image
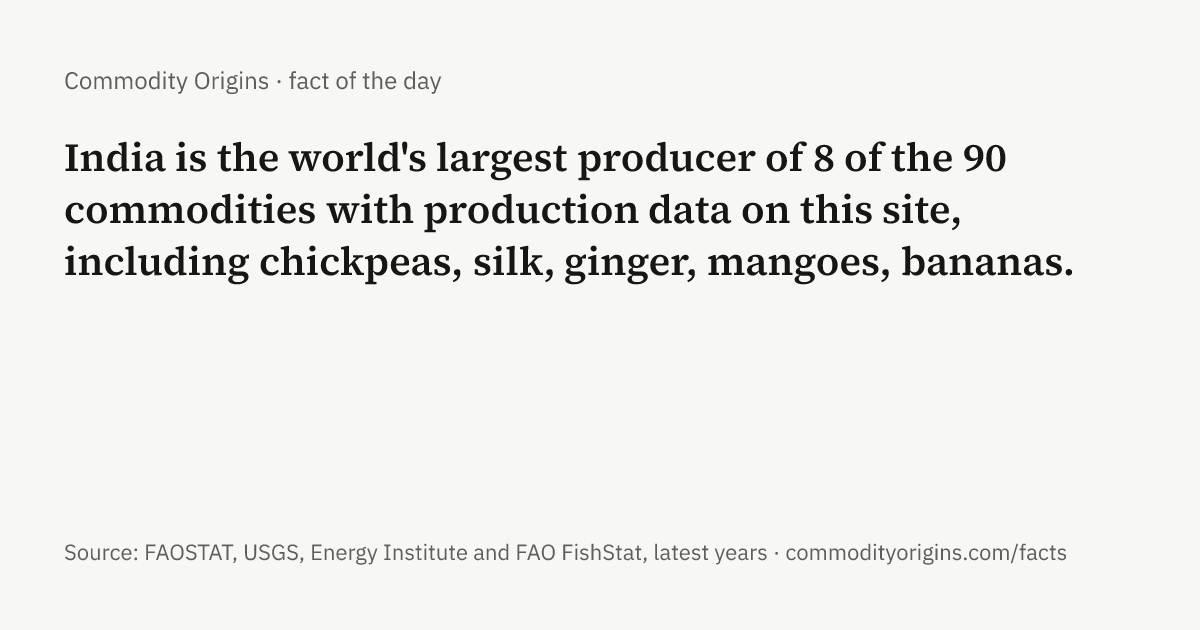
- India is the world's largest producer of 8 of the 90 commodities with production data on this site, including chickpeas, silk, ginger, mangoes, bananas. Source: FAOSTAT, USGS, Energy Institute and FAO FishStat, latest years. India · # · image
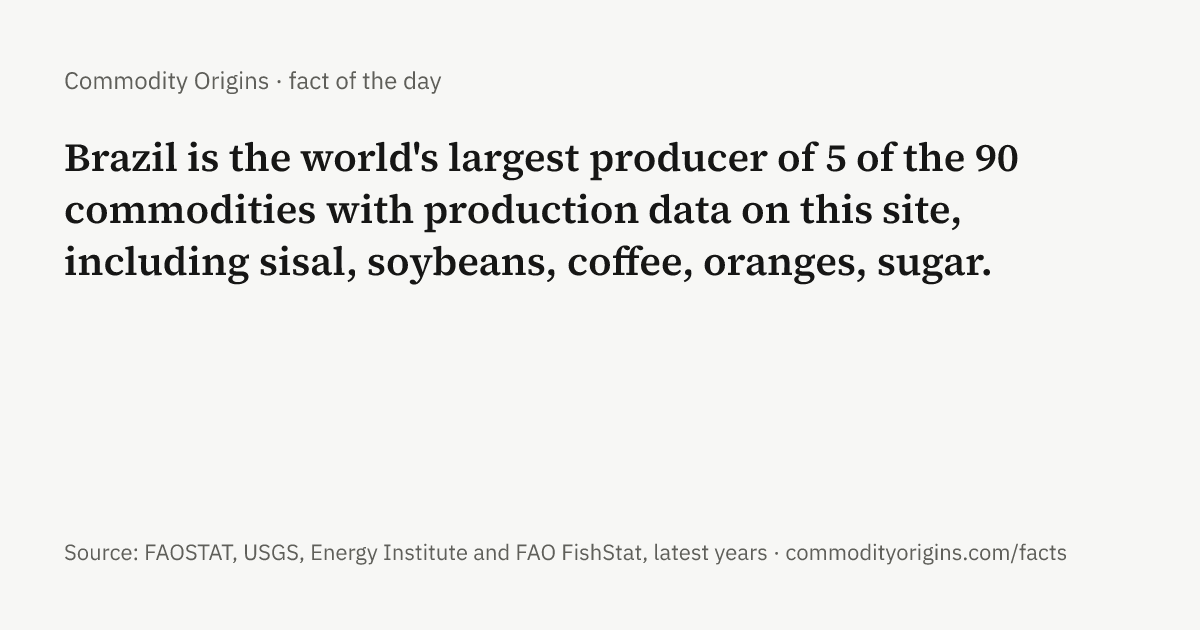
- Brazil is the world's largest producer of 5 of the 90 commodities with production data on this site, including sisal, soybeans, coffee, oranges, sugar. Source: FAOSTAT, USGS, Energy Institute and FAO FishStat, latest years. Brazil · # · image
- Brazil is the largest exporter by value of 8 of the 96 commodities with trade data on this site, including soybeans, orange juice, sugar, coffee, cotton. Source: CEPII BACI, 2024. Brazil · # · image
- Russia ranks in the top three producers of 16 of the 90 commodities with production data on this site. Source: FAOSTAT, USGS, Energy Institute and FAO FishStat, latest years. Russia · # · image
- Canada is the largest exporter by value of 6 of the 96 commodities with trade data on this site, including oats, lentils, potash, canola, sawnwood. Source: CEPII BACI, 2024. Canada · # · image
- The United States is the world's largest producer of 11 of the 90 commodities with production data on this site, including almonds, pistachios, corn, cheese, natural gas. Source: FAOSTAT, USGS, Energy Institute and FAO FishStat, latest years. United States · # · image
Stocks
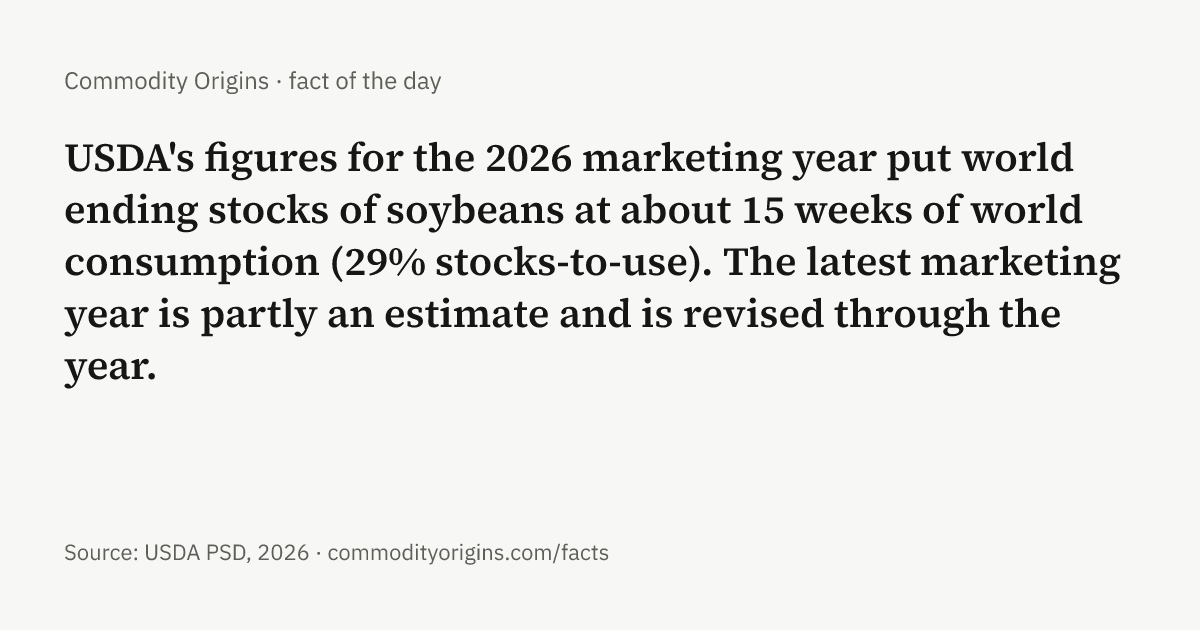
- USDA's figures for the 2026 marketing year put world ending stocks of soybeans at about 15 weeks of world consumption (29% stocks-to-use). The latest marketing year is partly an estimate and is revised through the year. Source: USDA PSD, 2026. Soybeans · # · image
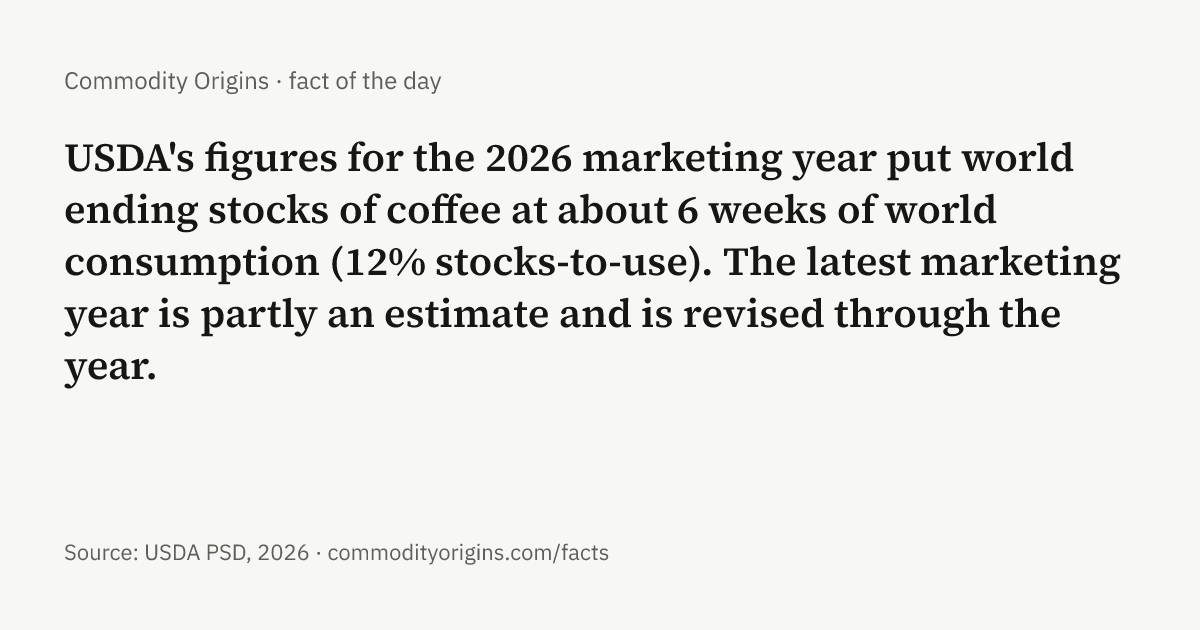
- USDA's figures for the 2026 marketing year put world ending stocks of coffee at about 6 weeks of world consumption (12% stocks-to-use). The latest marketing year is partly an estimate and is revised through the year. Source: USDA PSD, 2026. Coffee · # · image
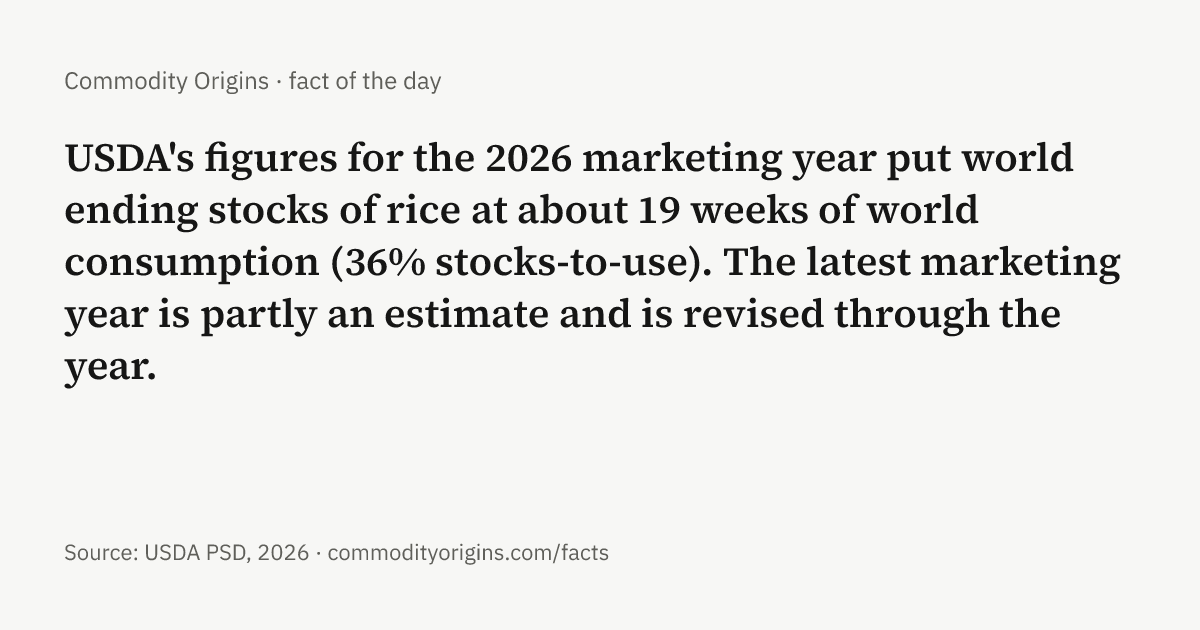
- USDA's figures for the 2026 marketing year put world ending stocks of rice at about 19 weeks of world consumption (36% stocks-to-use). The latest marketing year is partly an estimate and is revised through the year. Source: USDA PSD, 2026. Rice · # · image
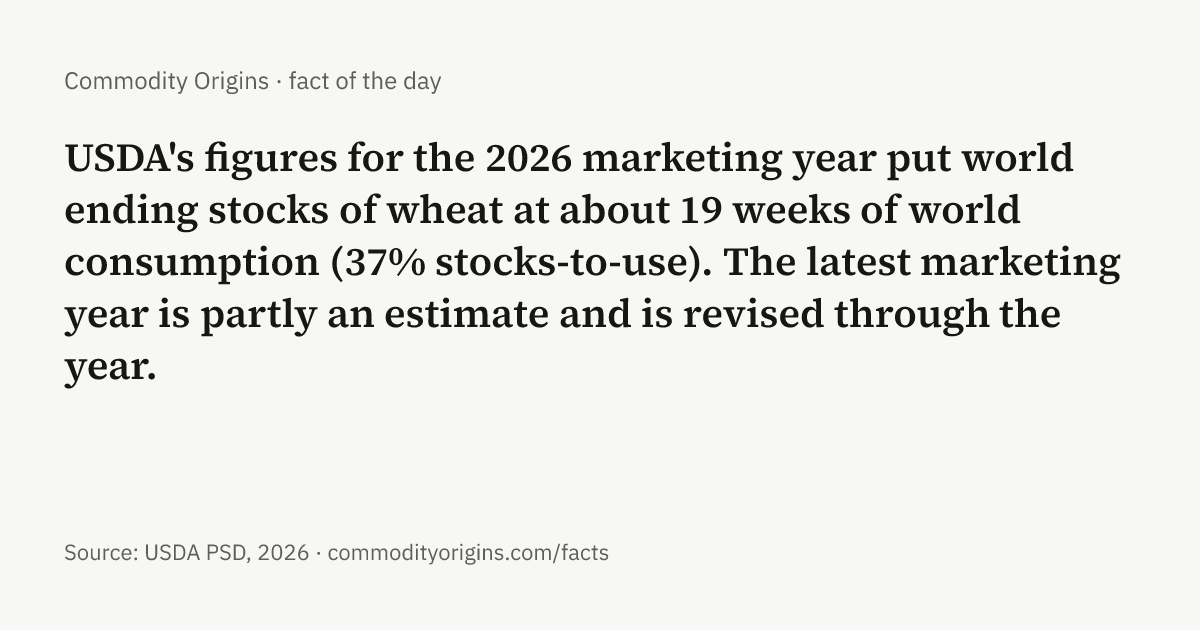
- USDA's figures for the 2026 marketing year put world ending stocks of wheat at about 19 weeks of world consumption (37% stocks-to-use). The latest marketing year is partly an estimate and is revised through the year. Source: USDA PSD, 2026. Wheat · # · image
- USDA's figures for the 2026 marketing year put world ending stocks of palm oil at about 10 weeks of world consumption (19% stocks-to-use). That is the lowest of the 6 years USDA shows. The latest marketing year is partly an estimate and is revised through the year. Source: USDA PSD, 2026. Palm oil · # · image
- USDA's figures for the 2026 marketing year put world ending stocks of corn at about 11 weeks of world consumption (22% stocks-to-use). That is the lowest of the 6 years USDA shows. The latest marketing year is partly an estimate and is revised through the year. Source: USDA PSD, 2026. Corn · # · image
Across the board
- For 48 commodities, the country that produces the most is not the country that exports the most. Producing, processing and trading are different jobs, and the countries that do them often differ. Source: FAOSTAT, USGS, Energy Institute and CEPII BACI, latest years. Producer vs exporter report · # · image
- The median commodity here has 72% of world production in its five largest producers. Only 10 of 90 have a top five below 50%. Source: FAOSTAT, USGS, Energy Institute and FAO FishStat, latest years. Concentration report · # · image
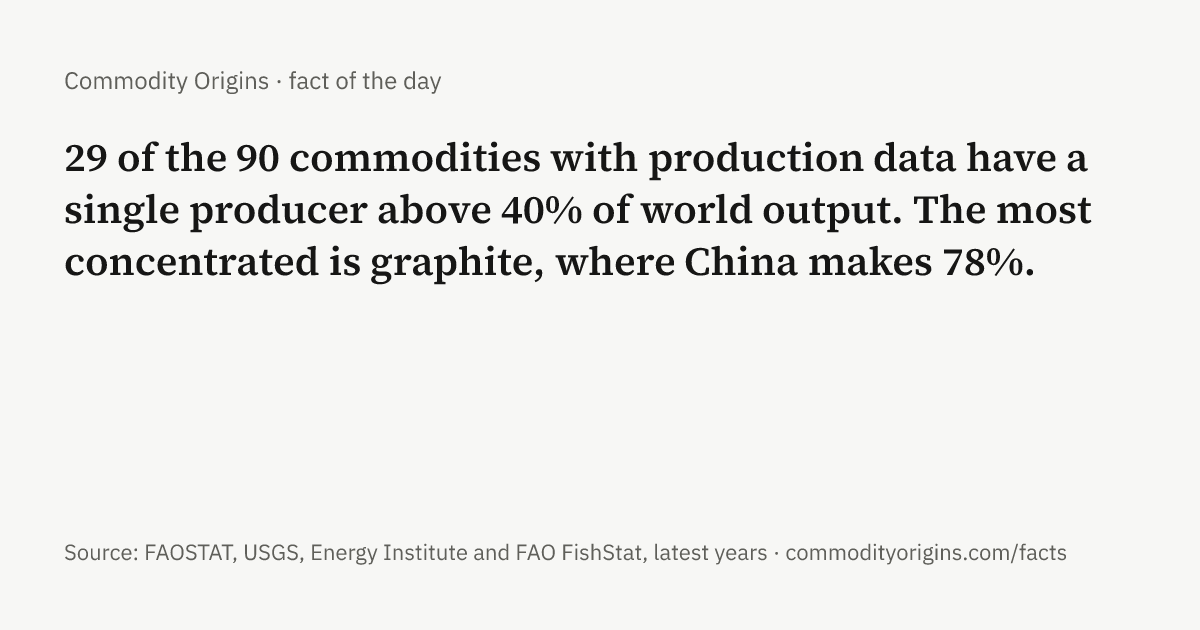
- 29 of the 90 commodities with production data have a single producer above 40% of world output. The most concentrated is graphite, where China makes 78%. Source: FAOSTAT, USGS, Energy Institute and FAO FishStat, latest years. Concentration report · # · image
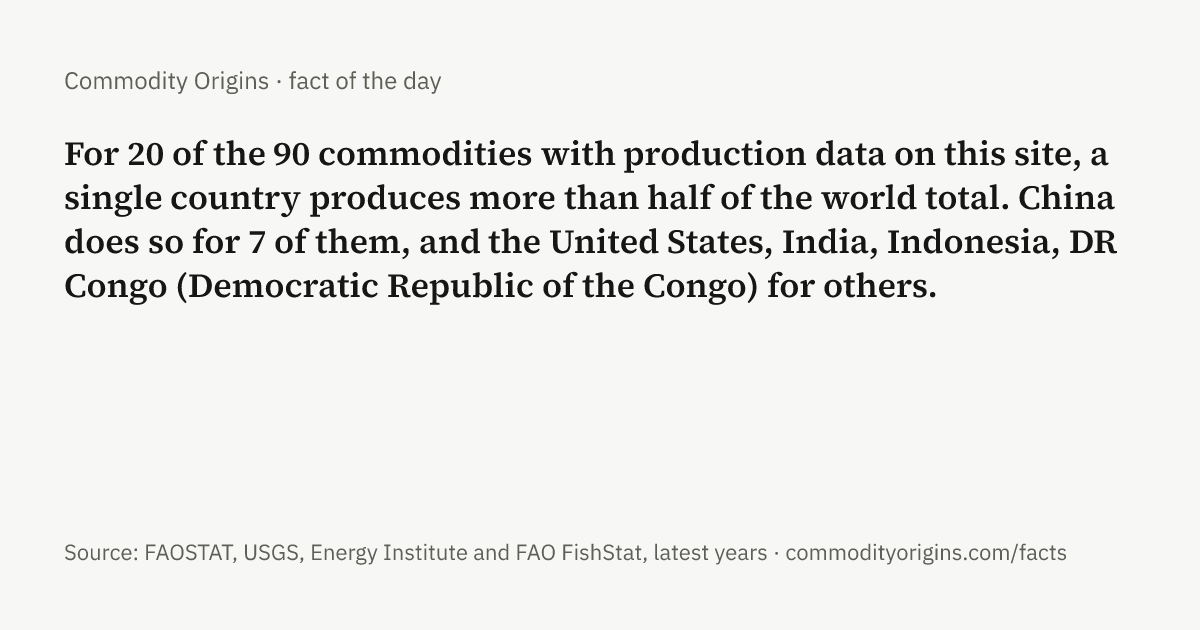
- For 20 of the 90 commodities with production data on this site, a single country produces more than half of the world total. China does so for 7 of them, and the United States, India, Indonesia, DR Congo (Democratic Republic of the Congo) for others. Source: FAOSTAT, USGS, Energy Institute and FAO FishStat, latest years. Concentration report · # · image
How these are made
A script reads the published commodity data and applies a fixed set of templates: the share of world output held by the top producer, the gap between the biggest producer and the biggest exporter, ten-year growth in a country's output, prices against their inflation-adjusted peaks, and so on. A template only produces a fact when the figure is large enough to be worth stating, and skips items whose data would mislead (a growth rate from a near-zero starting point, a series that has stopped updating, a proxy standing in for the real commodity). The fact of the day is the entry at position (days since 1 January 2026) modulo 370 in the list, so everyone sees the same fact on the same UTC date. The full list is available as JSON or as an RSS feed; the tables behind the bigger patterns are on the Patterns pages.
Facts generated 2026-10-04. Prices are monthly averages of benchmark quotes and are not investment advice.