Rice: who grows it, who sells it, and why the price is cheap
Rice is grown mostly where it is eaten, and only a small share of the crop ever crosses a border. In 2024 the world produced 819.8 million tonnes of paddy rice, and India and China together grew more than half of it (FAOSTAT). Yet the export market is dominated by different countries, and the benchmark price, at $471 a tonne in August 2026, is worth about 11% of its 1974 peak once inflation is removed. This article covers who grows rice, who sells it, who buys it, and what the data says about its price.
Two countries grow half of it
India grew 217.9 million tonnes in 2024, or 26.6% of the world total, and China grew 207.5 million tonnes, or 25.3% (FAOSTAT). Bangladesh follows at 7.4%, Indonesia at 6.5% and Vietnam at 5.3%. Those five together account for 71.1% of the crop, out of 135 producing countries. Thailand grew 4.1%, Myanmar 3.4% and the Philippines 2.3%.
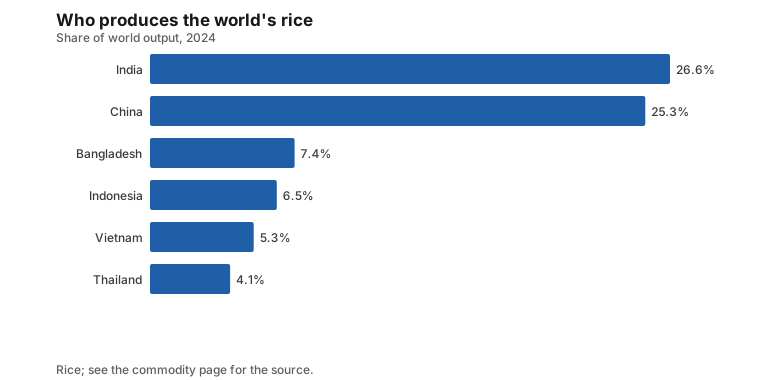
FAOSTAT counts rice as paddy, meaning unmilled grain. Milled rice, which is what is traded and eaten, weighs roughly two thirds as much. That is why USDA’s figure for world production in the 2024 marketing year, 540.7 million tonnes, is smaller than the FAOSTAT one. They measure different stages. See the rice commodity page for the full ranking, and the India and China pages for what else each country supplies.
USDA’s crop calendars put India’s main harvest in October to December, Thailand’s in November and December, Vietnam’s in February to April and Indonesia’s in February to May, with second crops in other months (see the harvest calendar).
Only a small part crosses a border
USDA estimates that world exports in the 2024 marketing year were 61.1 million tonnes against production of 540.7 million, so about 11% of the crop was traded. The rest is eaten in the country that grew it. Most consumers therefore never deal with the traded price directly.
The traded slice was worth $39.5 billion in 2024 (CEPII BACI, HS 1006). India sold $11.9 billion, or 30.0%, Thailand $6.7 billion (17.0%), Pakistan $4.1 billion (10.3%), Vietnam $4.1 billion (10.3%), the United States $2.5 billion (6.4%) and Cambodia $1.9 billion (4.8%). The top four exporters hold 67.6% of the value, which is far more concentrated than production. Compare producing, exporting and processing for why the three rankings differ.
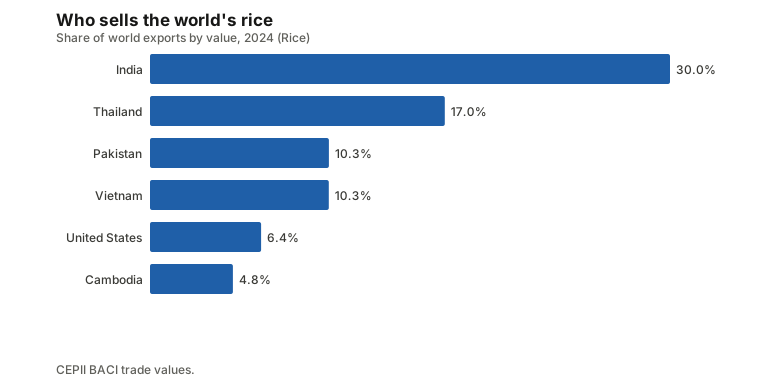
Thailand and Vietnam are the two other names to know. The benchmark this site tracks is the Thai 5% broken quote, Bangkok FOB, and the World Bank’s Pink Sheet also lists a Vietnamese 5% broken quote at $410.9 a tonne in August 2026, about 13% below the Thai price of $471. See the Thailand, Pakistan and Vietnam pages.
Buyers are scattered
The importing side looks nothing like the exporting side. The largest importer in 2024 was Indonesia at $2.7 billion, only 6.8% of world imports, followed by the Philippines at $2.5 billion (6.3%), Saudi Arabia at $1.9 billion (4.8%), Vietnam at $1.7 billion (4.3%), Iraq at $1.6 billion (4.2%) and the United States at $1.6 billion (4.0%) (CEPII BACI).
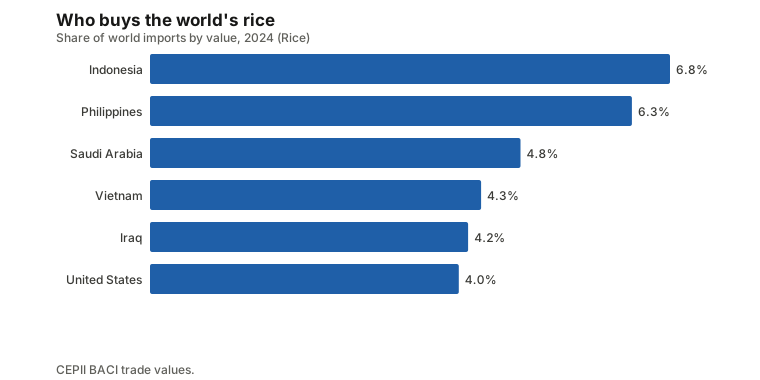
No importer takes even a tenth of the trade, while four exporters supply two thirds of it. Vietnam appears on both lists, but its net position is still $2.4 billion of exports over imports, and the net trade report shows the pattern across all commodities. The five largest net importers are Indonesia, the Philippines, Saudi Arabia, Iraq and Côte d’Ivoire. See also the concentration report.
What the price has done
The Thai 5% broken benchmark averaged $286.29 a tonne in 2005, $488.91 in 2010, $386.00 in 2015 and $496.75 in 2020. It averaged $436.75 in 2022, $553.67 in 2023 and $588.42 in 2024, then fell to $407.83 in 2025, a drop of 30.7% in one year. In August 2026 it stood at $471, which is 25.6% above a year earlier and 15.5% above the 2025 average (World Bank Pink Sheet). The highest monthly average in cash terms was $907 in April 2008, so the current price is about 52% of that.
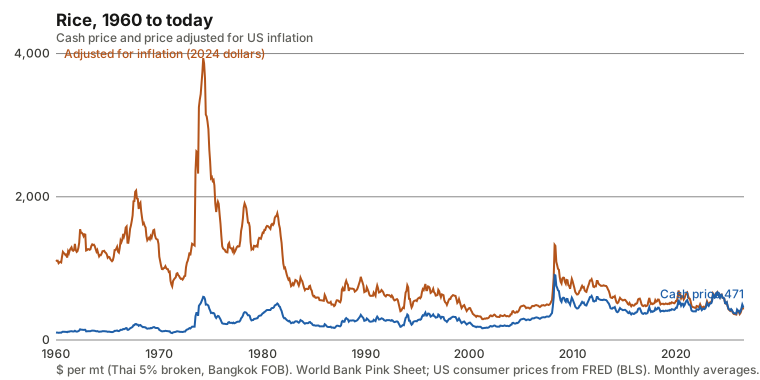
Adjusted for inflation, the picture is starker. The Pink Sheet series starts in 1960 at $104.50 a tonne in cash terms. Deflated by the US consumer price index to 2024 dollars, the peak was $3,936.55 in April 1974, and the August 2026 price of $471 is worth $442.20 in 2024 dollars, or 11.2% of that peak (see nominal versus real prices and the real prices report). The real price fell 92.6% from April 1974 to May 2001, a decline that took 325 months, and it has never recovered: it is 88.8% below the peak in August 2026, 628 months after it (see drawdowns). The same pattern appears across many commodities, as described in cheaper than 1974.
Volatility has risen. The annualised standard deviation of monthly changes was 13.7% in the 2010s and 20.4% in the 2020s so far. The price history shows each move.
Stocks, harvests and what the data can show
USDA’s balance sheets show a large buffer. World ending stocks were 179.9 million tonnes in the 2022 marketing year and 197.2 million in 2025, and USDA projects 191.7 million for 2026, which is 35.7% of consumption, or about 19 weeks. Much of it is generally understood to sit in a few large producing countries rather than in the traded market, which is background knowledge, not something this site measures. USDA’s 2026 figures are a projection and are revised through the year. The projection has consumption of 536.6 million tonnes slightly above production of 535.5 million. See stocks-to-use.
Over the long run, the stocks pattern holds. Across 66 years from 1960 to 2025, the rank correlation between stocks and the real price was −0.64: years of lower stocks went with higher prices. The median real price in the lowest third of stocks years was $1,290 a tonne in 2024 dollars, against $568 in the highest third (see stocks and prices). That is a correlation across years and covers a long period, so it need not describe the 2026 market.
The textbook says a smaller crop should raise the price, and here the data disagrees. Across 32 years from 1993 to 2024, the rank correlation between the change in world rice output and the change in the real price was +0.42, meaning larger crops went with higher prices, not lower (see supply shocks and prices). That report cautions that with 20 to 30 years of data, values between about −0.35 and 0.35 are hard to tell from noise, so +0.42 is a weak signal at best. It is a correlation, not a cause. This site cannot say which way any link runs.
Over the ten years to 2024, world output rose 8.9%, with harvested area up 3.7% and yield up 5.0%, from 4.52 to 4.75 tonnes per hectare (FAOSTAT, three-year averages; see land or yield).
What it does not follow
Rice has little to do with oil. The correlation of its monthly price changes with crude oil was −0.03 for 1996 to 2005, 0.17 for 2006 to 2015 and −0.25 over the last ten years (World Bank Pink Sheet; a correlation of changes, not a cause; see which prices follow oil). The last figure is negative, so rice did not rise with energy in the recent decade. The 2022 energy shock lifted many commodities, but rice averaged $436.75 that year, lower than in 2020.
For other grains, see the wheat and corn pages.
The data itself is unusually good. In 2024, 90.5% of world rice output came from official national statistics, 7.4% from international sources, 0.9% was estimated and 1.2% imputed by FAO, and none of the ten largest producers was flagged (FAOSTAT; see data reliability and sources).
A video on the crop itself
The video below is third-party content from the International Rice Research Institute about rice and its place in Asian life, and it is about the process and background, not this site’s data.
The short version
- India and China grew 51.9% of the world’s paddy rice in 2024, and five countries grew 71.1%.
- Only about 11% of the crop is traded. India, Thailand, Pakistan and Vietnam supply 67.6% of that trade by value, while no importer takes more than 6.8%.
- The Thai benchmark was $471 a tonne in August 2026, against a cash record of $907 in April 2008.
- Adjusted for inflation, rice costs about 11% of its April 1974 peak, and has been in a drawdown for 628 months.
- Stocks are large, about 19 weeks of use in USDA’s 2026 projection, and rice does not track oil.
Prices are monthly averages of benchmark quotes and lag the market. Nothing here is investment advice.
Commodities in this post
Prices are monthly benchmark averages that lag the market; informational only, not investment advice.