Wheat: who grows it, who exports it, who buys it
Wheat is the most widely grown grain in the world, and the countries that grow the most of it are mostly not the countries that sell it. In 2024 the world produced 798.5 million tonnes across 123 countries, and the five largest producers grew 53.3% of it (FAOSTAT). China alone grew 17.6%, yet it is not among the top 15 exporters. The countries that dominate exports are a different group, and the countries that import the most are different again. This article walks through those three lists, what the price has done, and what the data can and cannot say about why.
Five countries grow just over half
China grew 140.1 million tonnes in 2024, or 17.6% of world output. India followed with 113.3 million tonnes (14.2%), Russia with 82.6 million (10.3%), the United States with 53.7 million (6.7%) and Canada with 35.9 million (4.5%). Australia, Pakistan and France come next at 4.3%, 4.0% and 3.3%.
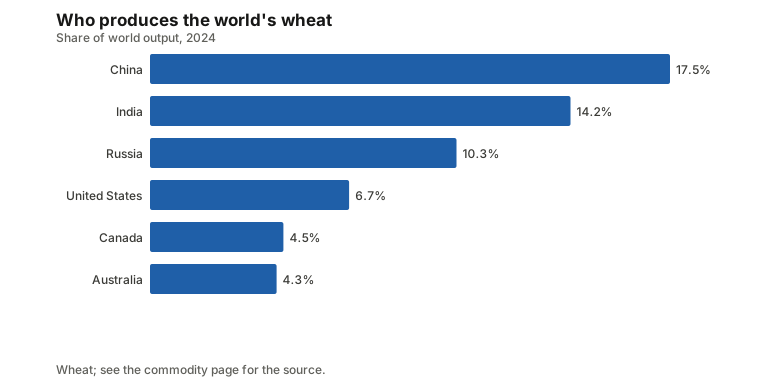
No single country holds even a fifth of the crop. Wheat is also harvested somewhere in almost every month. On this site’s harvest calendar, India picks in March and April, Pakistan in April and May, China in May and June, the United States in June and July, Russia, Ukraine and France in July and August, Canada in August and September, Australia from October to December, and Argentina in November to January. Of those ten countries, only February has no harvest listed.
The China page shows what else that country grows and sells.
The exporters are a different list
Wheat grain was traded across borders to a value of $57.5 billion in 2024 (CEPII BACI). Russia sold $9.1 billion of it, 15.7% of the world total. Canada sold $7.8 billion (13.6%), the United States $6.7 billion (11.7%), Australia $5.7 billion (9.9%), Ukraine $4.8 billion (8.3%) and France $4.2 billion (7.3%). The top five exporters together account for 59.2% of world export value, more concentrated than production (53.3%), and the top six for about two thirds.
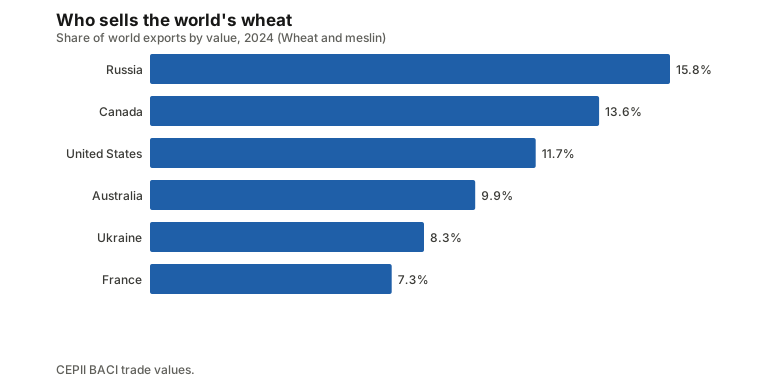
The difference from the producer list is the point. China grew more than twice as much as Russia in 2024 but is outside the top 15 exporters, because it mostly uses its own crop. Russia grew 10.3% of the world’s wheat and sold 15.7% of the world’s export value. Ukraine does not appear among the eight largest producers at all, but it is fifth among exporters. The producing versus exporting versus processing guide explains why these rankings diverge.
Processing adds a third ranking. Flour is a much smaller trade, $5.9 billion in 2024, about a tenth of the grain trade. Turkey is the largest flour exporter, at $1.2 billion or 19.7% of the world total, followed by Germany, Kazakhstan and Egypt. Turkey mills imported wheat, so its ranking says little about where wheat is grown.
The buyers are spread across many countries
Importing is far less concentrated than exporting. Egypt is the largest buyer of wheat grain, at $5.2 billion or 9.1% of the world total in 2024. Indonesia bought $3.2 billion (5.5%), China $2.9 billion (5.0%), Italy $2.5 billion (4.4%), Nigeria $2.1 billion (3.7%) and the Philippines $1.9 billion (3.3%). Those six together account for 30.9%, roughly half the share the top six exporters hold.
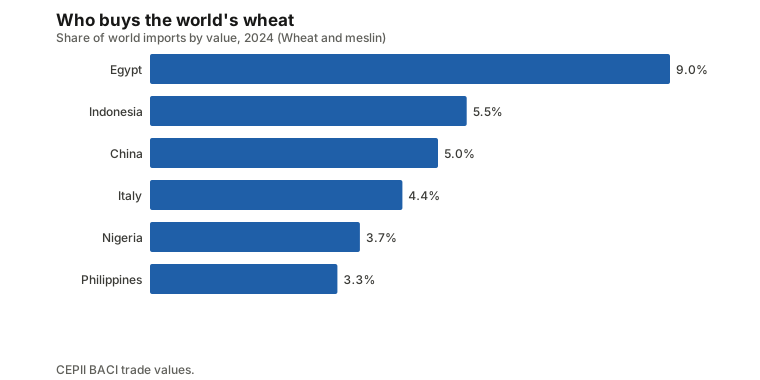
Many buyers depend on a handful of sellers. The data here cannot say how exposed any single importer is, because it counts dollars, not each country’s share of its own consumption. Flour imports follow a different order again, led by Afghanistan ($640 million, 10.8%), Iraq ($456 million, 7.7%) and the United States ($311 million, 5.3%).
The video below is by the Carnegie Endowment for International Peace, is not part of this site’s data, and covers how the wheat trade connects to food supply and the war in Ukraine rather than any numbers on this page.
What the price has done
The benchmark this site tracks is US hard red winter wheat, free on board at the Gulf of Mexico (World Bank Pink Sheet). It averaged $152.35 a tonne in 2005, $223.58 in 2010 and $231.58 in 2020. It rose to a yearly average of $429.98 in 2022, and the highest monthly average in the series, which starts in 1960, was $522.30 in May 2022. It then fell to $340.44 in 2023, $268.69 in 2024 and $243.35 in 2025. In August 2026 it was $330, which is 42.8% above a year earlier and 35.6% above the 2025 average, but still 36.8% below the 2022 record. The 2022 record came during the war in Ukraine, but this site’s monthly averages cannot separate that from other influences.
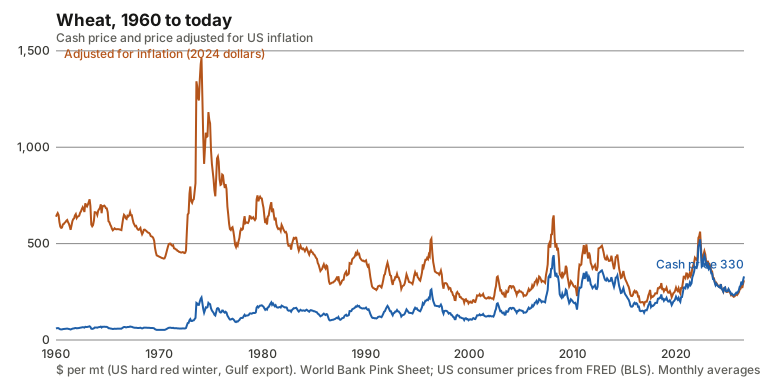
The cash record needs a qualifier. Adjusted for US inflation and expressed in 2024 dollars (see nominal versus real prices), the price in February 1974 was $1,462.38 a tonne. The August 2026 price of $330 is worth $309.82 in 2024 dollars, which is 21.2% of that peak. The drawdowns report puts the largest fall at 87.5%, from February 1974 to December 2016, a stretch of 514 months. The real price has not recovered since, and it is currently 78.8% below its peak, 630 months on.
A second US benchmark, soft red winter wheat, was $263.20 a tonne in August 2026, so the hard red winter price was 25.4% above it. Price swings are moderate for a crop: the annualised standard deviation of monthly changes was 22.5% in the 2010s and 20.9% in the 2020s so far.
Stocks, land and what the data says about supply
The textbook says that scarce stocks mean high prices. USDA’s estimates for the world balance show the market is not tight right now. For the 2026 marketing year, USDA has world production at 685.1 million tonnes and consumption at 707.1 million, so the world uses about 22 million tonnes more than it grows. Ending stocks are 259.2 million tonnes, a stocks-to-use ratio of 36.7%, about 19 weeks of consumption. The 2026 figures are partly a projection and get revised through the year. Ending stocks were 248.7 million tonnes (36.0%) in the 2024 marketing year and 261.1 million (37.1%) in 2025. The ratio has barely moved across these years while the price ranged from $243 to $330 (see the stocks-to-use guide).
Over the longer record, the link is weak. Across 66 years from 1960 to 2025, the rank correlation between world stocks and the inflation-adjusted price was 0.10 (a correlation, not a cause). The median real price in the third of years with the lowest stocks was $385.60 in 2024 dollars, and in the third with the highest stocks it was $497.66, the opposite of the textbook order. The site cannot show why; the stocks and prices report has the full result. A separate check on supply shocks across 32 years, 1993 to 2024, gives a rank correlation of 0.18, also weak (see supply shocks and prices).
Wheat output has grown almost entirely through yield, not land. Comparing three-year averages, world production rose 14.0% over the ten years to 2024, from 701.9 to 800.3 million tonnes. Harvested area rose just 0.2%, from 218.2 to 218.6 million hectares, while yield rose 13.8%, from 3.22 to 3.66 tonnes a hectare (FAOSTAT; see land or yield).
What does not move it
Its link with the oil market is weak. The correlation of its monthly changes with crude oil’s was 0.05 in 1996 to 2005, 0.23 in 2006 to 2015 and 0.09 over the last ten years. These are correlations of monthly changes, not causes (see which prices follow oil).
The data itself is in good shape. In 2024, 83.2% of world wheat output came from official national statistics, 15.3% from international sources, 1.0% was estimated and 0.4% imputed by FAO, and none of the ten largest producers was flagged (FAOSTAT).
The short version
- The world grew 798.5 million tonnes of wheat in 2024, and five countries grew 53.3%, led by China at 17.6%.
- Exports are more concentrated than production: Russia, Canada, the United States, Australia and Ukraine sold 59.2% of the $57.5 billion in grain trade.
- Imports are spread wider: Egypt, the largest buyer, took 9.1%, and the top six importers took 30.9%.
- The price was $330 a tonne in August 2026, 42.8% above a year earlier and 36.8% below the May 2022 record of $522.30.
- Adjusted for inflation, wheat costs 21.2% of its February 1974 peak, and the real price has not recovered in 630 months.
- Over ten years, output grew 14.0%, almost all from higher yield.
- Stocks-to-use has stayed near 36% to 37% in recent marketing years, and across 66 years the link between stocks and price is weak.
Prices are monthly averages of benchmark quotes and lag the market. Nothing here is investment advice. To explore further, start with the wheat commodity page and the wheat price history.
Commodities in this post
Prices are monthly benchmark averages that lag the market; informational only, not investment advice.