Saudi Arabia: oil above all, and what else it sells
Saudi Arabia is the country most identified with a single commodity, and the data mostly agrees: crude oil accounted for 94.9% of the export value this site can track for Saudi Arabia in 2024 (CEPII BACI). But “mostly” is doing work there. This site tracks 96 commodities, Saudi Arabia trades 24 of them, and 94.9% is a share of that narrower basket, not of the country’s true total exports, which also include petrochemicals and other manufactured goods this site does not price. Saudi Arabia is also the world’s largest date grower and a smaller exporter of natural gas, urea and a handful of foods. This article sets out what the data shows, and is explicit about where the picture is incomplete.
A top-two oil producer, and the top date grower
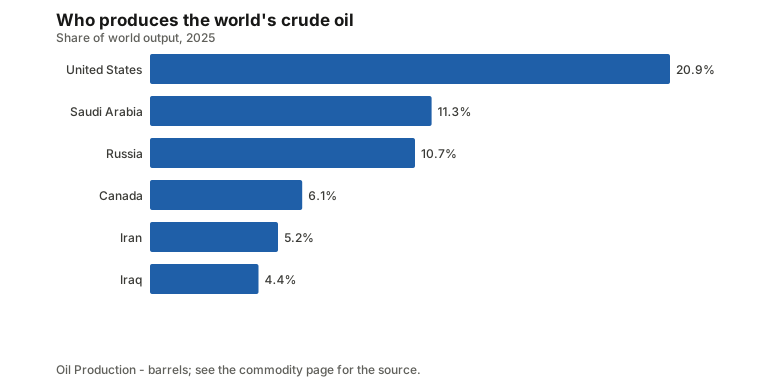
In 2025 Saudi Arabia produced 11.4 million barrels a day of crude oil and related liquids, 11.3% of the world total and the second-largest share behind the United States, as the crude oil post on this site covers in full (Energy Institute Statistical Review). Natural gas output was smaller relative to the world: 133.8 billion cubic metres in 2025, ranking eighth at 3.2% of world production (Energy Institute).
Away from energy, Saudi Arabia’s biggest global ranking is not oil at all. It grew 1.93 million tonnes of dates in 2024, 19.4% of world output, the largest share of any country (FAOSTAT). It also ranked sixth in phosphate rock, 4.0% of world mine output at 10 million tonnes in 2025, and eighth in bauxite, 1.3% at 5.7 million tonnes (USGS Mineral Commodity Summaries). Phosphate rock matters because it feeds the fertilizer exports below. See the Saudi Arabia country page for the full ranking, and the concentration report for how these shares compare with other countries.
The world’s largest seller of crude oil
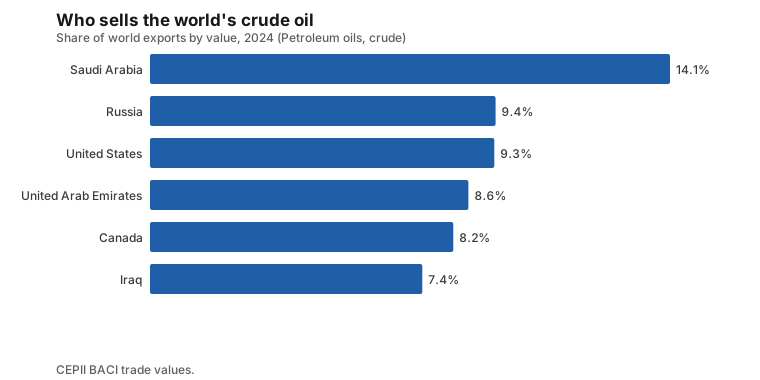
Production and export shares are not the same measure, and Saudi Arabia is a case where they diverge. Its 11.3% of world oil production translated into 14.1% of world crude export value in 2024, $186.9 billion, the largest of any country (CEPII BACI). That is a higher export share than production share, the mirror image of the United States, which pumps about twice as much oil but exported a smaller share of world value in 2024 because it burns most of what it produces. The producing, exporting and processing guide explains why the three rankings differ; the full country breakdown on both sides of the trade is in the crude oil post rather than repeated here. See also the crude oil commodity page and the Brent price history.
Dates, urea and a smaller trading book
Outside of oil, Saudi Arabia’s export list is short but genuine. It sold $441.6 million of dates in 2024, 18.0% of world export value, the largest share of any country, matching its top rank in production (CEPII BACI). It sold $1.63 billion of urea, a nitrogen fertilizer made from the country’s natural gas and phosphate rock, ranking fourth at 8.0% of world export value. Two smaller lines round out its top five tracked non-oil exports: cardamom, $10.1 million, 0.8% and tenth-ranked, and sugar, $599.2 million, 1.4% and also tenth-ranked.
Sugar is worth a second look, because Saudi Arabia is at the same time a net importer of it: $2.12 billion bought in 2024, the world’s third-largest buyer, against the $599.2 million sold, a net import of $1.52 billion. That gap fits a refining and re-export role rather than growing cane or beet. The same shape appears in cardamom, $234.3 million imported against $10.1 million exported, more regional spice trading than growing the crop. The net trade report and the producing, exporting and processing guide cover this kind of gap between production, imports and re-exports.
One commodity is 94.9% of what this site can track
Crude oil’s $186.9 billion made up 94.9% of the $197.0 billion in tracked exports this site has for Saudi Arabia in 2024, with natural gas a distant second at $4.5 billion (2.3%), urea at $1.6 billion (0.8%), aluminum at $814.6 million (0.4%) and copper at $637.5 million (0.3%) (CEPII BACI). That is one of the highest single-commodity dependency ratios this site records anywhere, and it is a genuine concentration, not an artifact of a trading hub re-exporting someone else’s goods, the caveat that applies to entrepôts like Singapore or the UAE. The export dependency report is built for exactly this comparison.
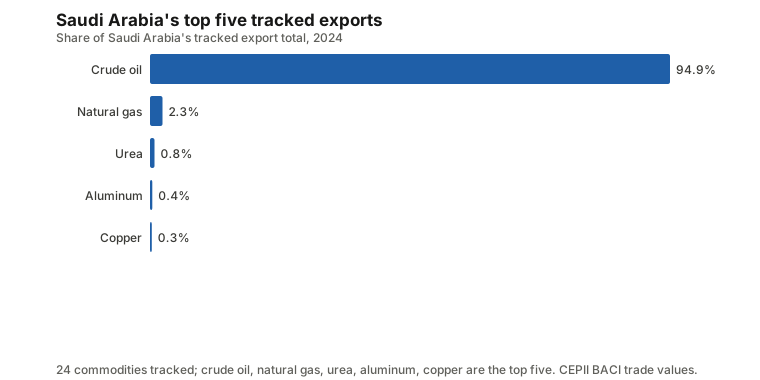
The qualifier is in what 94.9% leaves out. It is a share of the 24 commodities this site has trade data for, out of the roughly 96 it tracks, and says nothing about petrochemicals, plastics or refined fuels that Saudi Arabia also exports at scale through firms such as Aramco and SABIC. Those product lines are not commodities this site prices, so oil’s true share of total exports is almost certainly lower than 94.9%, even though crude oil is unambiguously the largest single line.
A large net exporter of energy, a net importer of food and gold
Across the commodities it trades, Saudi Arabia is a net exporter in 8 and a net importer in 47, for a combined net surplus of $168.8 billion (CEPII BACI, 2024). That surplus is almost entirely the energy trio: crude oil at a net $186.9 billion, natural gas at $4.5 billion and urea at $1.6 billion, with dates adding $441.6 million. On the other side, the largest net imports are gold at $8.1 billion, steel at $1.9 billion, rice at $1.9 billion and barley at $868.1 million, alongside smaller net imports of tea, cardamom, chickpeas, plantains, cinnamon and cloves. That fits an economy that imports gold for jewelry and investment, most of its grain, and steel for construction; it is the shape the net trade report finds for many oil and gas exporters, a few very large net export lines offsetting a long list of smaller net imports.
What this data cannot show: OPEC, reserves and the rest
Saudi Arabia is widely described as the world’s swing producer and the largest member of OPEC, a real role worth naming lightly. But this site does not track OPEC’s production quotas, so it cannot show how a quota decision has affected output or price in a given month, and the crude oil post makes the same point about the wider market: any link between an OPEC decision and a price move goes beyond what monthly production, trade and price data can demonstrate. That post’s own findings on the Brent price, including a June 2008 real peak and 41.5% annualised volatility in the 2020s so far, are Saudi Arabia’s price backdrop as top exporter, but they are that post’s numbers, not new ones calculated here.
There is a second, more basic gap. The fact sheet behind this article carries no top-10 reserves entry for Saudi Arabia, so despite the country’s well-known standing in global proved oil reserves, this site will not repeat a widely cited figure it cannot verify against its own reserves data. The reserves report covers the countries this site can rank on that measure. For the mechanics of buying and selling oil forward rather than at the spot prices tracked here, see contango and backwardation; for how trade routes can shift under sanctions, see sanctions and commodities — Saudi Arabia’s exports are not sanctioned, but its Asian buyers operate in a market where other suppliers have been.
For scale, in 2025 the Wall Street Journal published a video on how Aramco, the state oil company, became the world’s largest company by some measures. It is third-party reporting, not this site’s data, and covers corporate history rather than the figures above:
The short version
- Saudi Arabia produced 11.3% of the world’s oil in 2025 (second after the United States) and sold 14.1% of world crude export value in 2024, the largest of any country.
- It is also the world’s largest date grower, 19.4% of world output in 2024, and a top-10 producer of phosphate rock and bauxite.
- Crude oil was 94.9% of Saudi Arabia’s $197.0 billion in tracked exports in 2024; that is a share of the 24 commodities this site tracks for the country, not of its true total exports, which also include untracked petrochemicals and manufactured goods.
- It runs a combined net trade surplus of $168.8 billion across tracked commodities, built almost entirely on crude oil, natural gas and urea, while running net imports of gold, steel, rice and barley.
- This site does not track OPEC quotas or hold a reserves ranking for Saudi Arabia, so neither appears here as a sourced figure.
Prices are monthly averages of benchmark quotes and lag the market. Nothing here is investment advice. To explore further, start with the Saudi Arabia country page and the crude oil commodity page. The video above is from a third party and is shown for background only.
Commodities in this post
Prices are monthly benchmark averages that lag the market; informational only, not investment advice.