Crude oil: who produces it, who buys it, and the price
The country that pumps the most crude oil is not the country that sells the most of it, and the biggest buyer is not a big producer at all. In 2025 the United States produced 21.1 million barrels a day, 20.9% of the world total (Energy Institute Statistical Review), yet in 2024 Saudi Arabia led crude exports with 14.1% of world export value and the United States ranked third with 9.3% (CEPII BACI). China, which produces 4.3% of the world’s oil, bought 24.0% of the crude that crossed borders. This article sets out who produces, who exports and who imports, then what the Brent price has done and what it can and cannot tell us. The price series is the World Bank’s Brent benchmark, and where another benchmark is meant, the text says so.
Five countries produce 54% of the world’s oil
In 2025 the world produced 100.6 million barrels a day, counting crude oil, shale oil, oil sands, condensates and natural gas liquids together (Energy Institute Statistical Review, 50 producing countries). The United States is first at 21.1 million barrels a day, or 20.9%. Saudi Arabia follows at 11.4 million (11.3%), Russia at 10.7 million (10.7%), Canada at 6.2 million (6.1%) and Iran at 5.2 million (5.2%). The top five together make 54.2%. Iraq (4.4%), China (4.3%) and the United Arab Emirates (4.2%) come next.
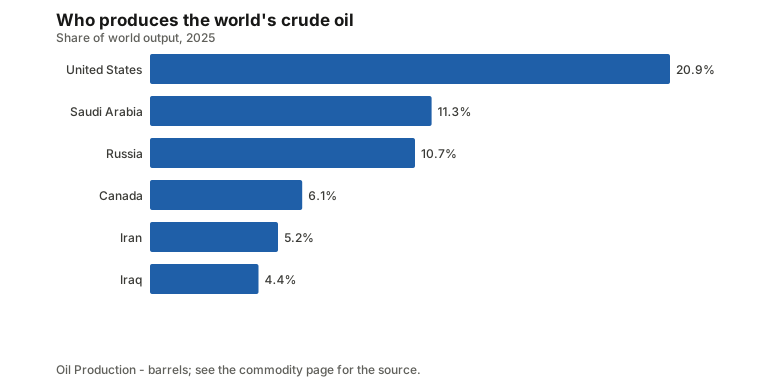
The United States produces about 1.85 times as much as Saudi Arabia, which is not the picture most people carry from the 1970s. The Energy Institute figure includes condensates and natural gas liquids, so a narrower crude-only measure can rank countries differently. The crude oil page shows the full ranking, and the United States, Saudi Arabia and Russia pages show what else each country sells. The concentration report compares this spread with other commodities.
Producing is not the same as exporting
A large producer with a large economy burns much of what it pumps. In 2024 the world traded $1,324 billion of crude oil (CEPII BACI, HS 2709). Saudi Arabia sold $186.9 billion, 14.1% of that. Russia followed with $124.2 billion (9.4%), the United States with $123.7 billion (9.3%), the United Arab Emirates with $114.4 billion (8.6%), Canada with $109.0 billion (8.2%) and Iraq with $97.9 billion (7.4%). The six together supplied 57.1% of the world’s export value.
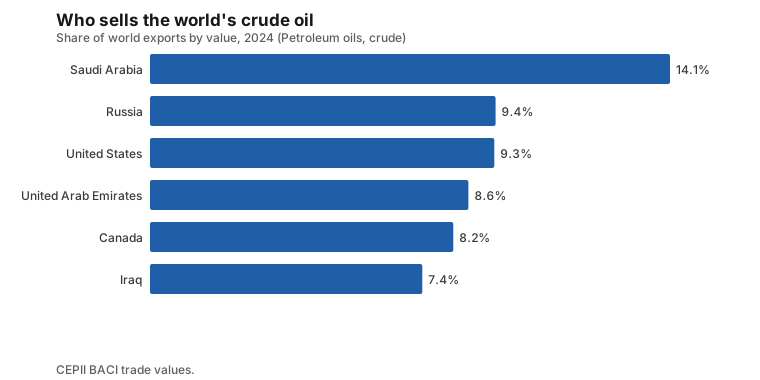
The United States is the clearest case. It produced 20.9% of the world’s oil in 2025 but accounted for 9.3% of crude export value in 2024. Imports still exceeded exports: it bought $169.2 billion of crude and sold $123.7 billion, a net import of $45.5 billion. The years differ and trade is a value, not a volume, so this compares shares, not barrels. The producing, exporting and processing guide explains why the three rankings differ, and the net trade report lists the net exporters. By value, Saudi Arabia, Russia, the United Arab Emirates, Iraq and Canada are the five largest net crude exporters.
Four Asian economies buy nearly half
The buying side is more concentrated than the selling side. China imported $318.4 billion of crude in 2024, 24.0% of the world total. The United States bought $169.2 billion (12.8%), India $141.8 billion (10.7%), South Korea $84.5 billion (6.4%), Japan $73.1 billion (5.5%) and the Netherlands $54.8 billion (4.1%). China, India, South Korea and Japan together bought 46.7%, and China alone bought 1.7 times what Saudi Arabia sold.
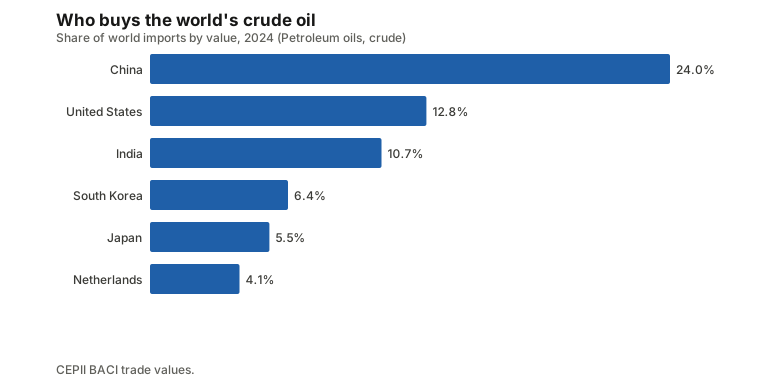
These are refining economies as much as consuming ones. Crude is a raw material that becomes petrol, diesel, jet fuel and petrochemical feedstock. The refined-product trade, a separate market, was $883.6 billion in 2024 (HS 2710) and is led by the United States (12.8% of exports), India (6.6%), Singapore (6.4%), South Korea (5.8%) and the Netherlands (5.7%). Several of the largest crude buyers are also large refined-product sellers, Ships carry most of this trade, and sanctions can redirect it (see sanctions and commodities). That is background; the site does not measure shipping routes.
What the price has done
The World Bank’s Brent series (dated Brent, 38 degrees API) began at $1.60 a barrel in January 1960. Annual averages were $54.44 in 2005, $79.64 in 2010, $52.37 in 2015, $42.30 in 2020, $99.83 in 2022, $82.63 in 2023, $80.71 in 2024 and $69.05 in 2025. The highest monthly cash average was $133.9 in July 2008. In August 2026 Brent averaged $90.90, which is 33.3% above a year earlier (World Bank Pink Sheet).
Brent is one of several benchmarks. In August 2026 the same source gave $82.70 for WTI (the US benchmark), $79.70 for Dubai Fateh and $84.40 for the average of the three. Grades and locations differ, so benchmarks do. The benchmarks guide explains why, and the price page has the full history.
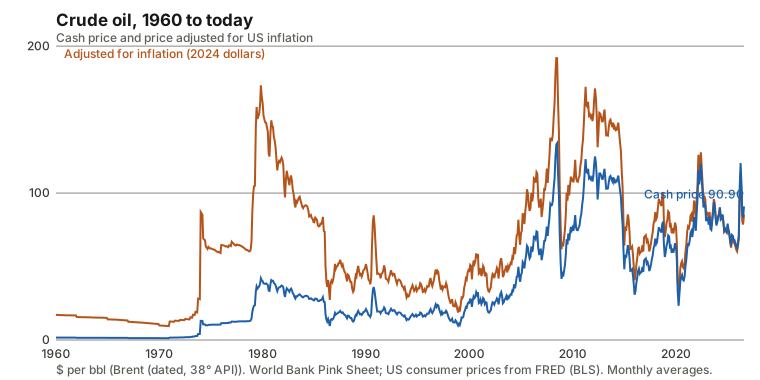
Inflation changes the reading. Deflated by US consumer prices to 2024 dollars, the peak was $191.86 a barrel in June 2008, and the August 2026 price of $90.90 is worth $85.34 in those dollars, 44.5% of that peak (see nominal versus real prices). That is 55.5% below the high, 218 months on. The real prices report shows the same adjustment for other commodities.
Long slumps and wide swings
The drawdowns report finds one very deep hole. From its real peak in November 1979 the inflation-adjusted price fell 89.2% to a trough in December 1998, a slide of 229 months. It took a further 113 months, until May 2008, to recover the 1979 level. That is 342 months, or 28 and a half years, between one real high and the next.
Volatility, measured as the annualised standard deviation of monthly changes, was 26.6% in the 2010s and is 41.5% in the 2020s so far. The 2020s window includes the low annual average of 2020 and the high one of 2022, and this measure cannot say what drove either. For the 2022 episode, which pushed gas and coal up much more than oil, see the 2022 energy shock, and for the general mechanics why commodity prices spike and commodity supercycles.
Which prices follow oil
Oil is often treated as the anchor of other commodity prices. The oil link report tests that, using correlations of monthly price changes across 42 commodities. It is a correlation, not a cause: two prices can move together because both respond to the same demand or currency shocks.
Over the last ten years (from September 2016), the closest were aluminum (0.45), cotton (0.44), palm oil (0.40), sugar (0.37) and canola (0.37). In 2006 to 2015 the pattern was stronger and different: copper (0.65), canola (0.58), aluminum (0.56), natural rubber (0.53) and tin (0.51) led. Coal, an energy fuel, was 0.49 in 2006 to 2015 and 0.24 in the last ten years. Natural gas was 0.05 in the last ten years, consistent with the regional gas markets the energy shock page describes, and coffee was -0.08. So oil’s link with other prices exists but weakens and changes with the period, and no commodity in the last ten years shows a coefficient above 0.45. See the pages for natural gas and coal for their own geography.
What the site cannot tell you
The site tracks production, trade and monthly price benchmarks. It does not track production quotas set by producer groups such as OPEC, nor inventories, nor refinery capacity, so it cannot show how those affected any price move. Any account linking a month’s move to a specific decision goes beyond these data.
Futures matter here too. The benchmark tracked by this site is a monthly average of physical quotes, while the traded contracts are Brent on ICE and WTI on NYMEX. The gap between near and far contracts is covered in contango and backwardation and spot versus futures. For an explainer on what moves the price, CNBC has a video. It is third-party and dates from 2018, and it covers the process and background, not this site’s data:
The short version
- The United States produced 20.9% of the world’s oil in 2025 and Saudi Arabia 11.3%, but Saudi Arabia was the top crude exporter in 2024 with 14.1% of export value; the United States ranked third.
- China bought 24.0% of imported crude in 2024, and China, India, South Korea and Japan together bought 46.7%.
- Brent was $90.90 in August 2026, 33.3% above a year earlier, against a cash record of $133.9 in July 2008.
- Adjusted for inflation, the price is 44.5% of its June 2008 peak, and the 1979 real high took 28 and a half years to be regained.
- Oil’s correlation with other commodities’ monthly changes is at most 0.45 over the last ten years, and it has changed between periods.
Prices are monthly averages of benchmark quotes and lag the market. Nothing here is investment advice. To explore further, start with the crude oil commodity page and the Brent price history. See also the China and India pages and the sources page.
Commodities in this post
Prices are monthly benchmark averages that lag the market; informational only, not investment advice.