Copper hits a record: Chile mines it, China buys it
Copper set a new cash record in August 2026: the World Bank’s benchmark, the London Metal Exchange cash price for grade A cathode, averaged $14,326 a tonne (World Bank Pink Sheet). That is 48.1% higher than a year earlier and 86.1% higher than twenty years ago. Behind the number is a supply chain with an unusual shape. A small group of countries digs the ore out of the ground, one country buys most of it, and the two sides are on different continents. This article explains that geography, what the price history shows once inflation is removed, and what the record does and does not tell us.
Five countries mine 62% of it
In 2025 the world mined 23.0 million tonnes of copper, measured as the copper content of the ore, and refined 29.0 million tonnes of copper metal (USGS Mineral Commodity Summaries). Chile is the largest miner at 23.0% of the world total. The Democratic Republic of the Congo follows at 13.9%, Peru at 11.7%, China at 7.8%, Russia at 5.7% and the United States at 4.3%. The top five together account for 62.2%.
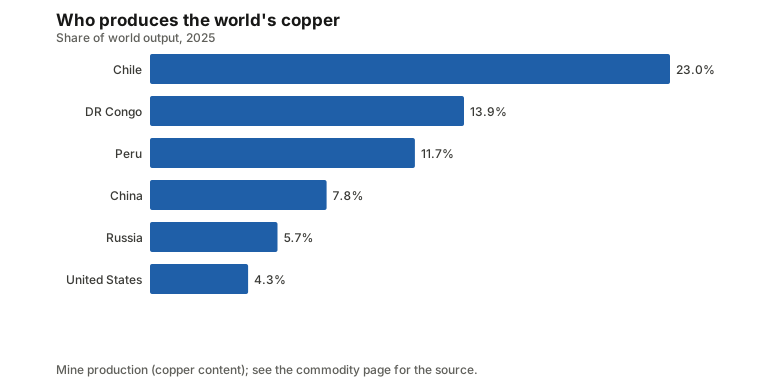
That is more concentrated than most metals people think of as “common”, although less than the minor metals that the critical minerals guide covers. The copper commodity page shows the ranking for every year, and the Chile, Peru and DR Congo pages show how much else each country sells.
Copper is a product of the ground, so the map barely changes: deposits are where they are, and a new mine takes years to permit, build and bring to full output. That is why demand-driven price rises, such as the one in the 2025 metals rally, so often outrun what supply can do in the short run.
The ore goes to one buyer
A large part of the trade is in ore, not metal. Chile and Peru export ore and concentrate, and China imports it to smelt and refine. In 2024 the world traded $105.9 billion of copper ores and concentrates (CEPII BACI, HS 2603). Chile sold $30.9 billion of that, 29.2% of the world’s export value, and Peru sold $20.5 billion, 19.3%. Indonesia sold $8.4 billion and Australia $4.6 billion.
The buying side is far more concentrated than the selling side. China bought $66.2 billion of the ore, or 62.5% of the world’s imports. Japan bought $13.5 billion, South Korea $4.1 billion and India $4.0 billion.
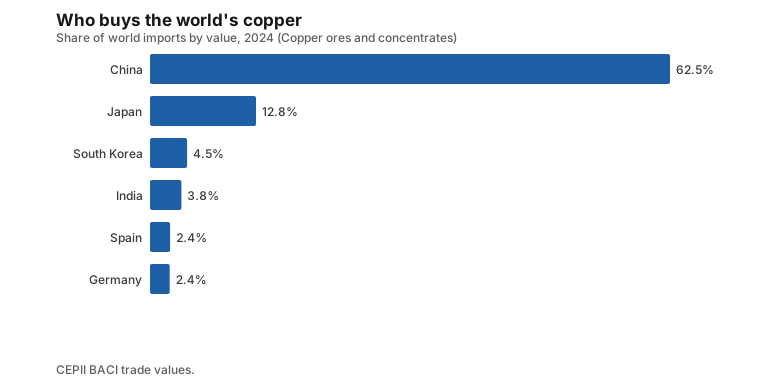
So the market has two very unequal sides. The five biggest miners share 62.2% of output between them, but one country takes more than six dollars in every ten spent on imported ore. The net trade report puts this in a wider frame: China has the largest combined trade deficit of any country across the 96 commodities tracked, with crude oil, iron ore and natural gas its largest net imports.
This is the difference between producing and processing that the guide to producing, exporting and processing describes. Ranking countries by mine output says where copper comes from, while ranking them by refined output says where it is made into the cathode that goes into wire. For refined copper (HS 7403) the leading exporters are Chile, the DR Congo and Japan.
Watch how the metal is made
If you want to see what happens between the mine and the wire, the engineerguy channel has an engineering explainer on how copper is extracted. It is not this site’s work, and it covers the process, not the market:
The video is a useful reminder that ore is not the finished product. Copper is concentrated, smelted and refined in separate steps, and each step is a place where a country can add value or a bottleneck can appear.
What the record really means
Copper averaged $5,511 a tonne in 2015 and $6,174 in 2020. It averaged $9,142 in 2024 and $9,947 in 2025 before reaching $14,326 in August 2026. The series starts in 1960 at $715 a tonne, so the latest price is about twenty times the first.
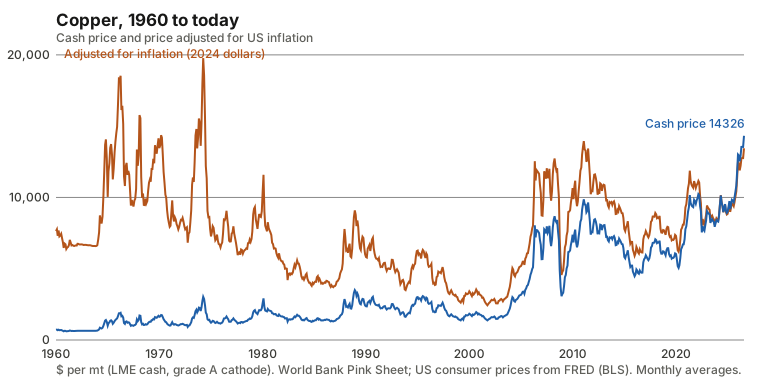
Adjust for inflation and the picture changes. Deflated by the US consumer price index to 2024 dollars, copper cost $19,774 a tonne in April 1974. The August 2026 price is worth $13,450 in 2024 dollars, which is 68% of that peak, or 32% below it. The worst fall in the series ran from April 1974 to October 2001, when the real price dropped 87.7%. It took 330 months, nearly 28 years, to fall that far, and the price has not returned to the old high (see the drawdowns report and nominal versus real prices). A record in cash terms therefore means the highest ever number in the series but not the most expensive copper has ever been in what it buys.
Is copper tied to oil and the economy?
Copper is often called a barometer of the global economy, so it is worth checking how closely it has followed the energy market. The correlation of copper’s monthly price changes with crude oil’s was 0.21 in 1996 to 2005, 0.65 in 2006 to 2015 and 0.30 over the last ten years (World Bank Pink Sheet; a correlation of monthly changes, not a cause). The 2006 to 2015 figure was the highest of the 42 prices in that comparison, though the data cannot say why. The oil link report shows that across commodities as a group the link was strongest in 2006 to 2015 and has since eased.
Volatility has stayed moderate, and lower than for coffee: the annualised standard deviation of monthly changes was 15.9% in the 2010s and 17.0% in the 2020s so far.
How to check this yourself
Every number above comes from a table you can open. The copper commodity page lists production by country with the year and source, and the trade tables for ore and refined metal sit beside it. The price page has the monthly series since 1960 and lets you switch between cash and inflation-adjusted values. The August roundup records the month copper set its record, and the monthly changes reports show how unusual each month’s move was against the whole history. If a figure ever disagrees with an official source, the sources page says which vintage of which dataset we used and when it was last refreshed.
What could change the picture
Three things to watch, each of which can be checked against the data on this site.
Price against cost. A price at a record in cash terms is a signal to mine owners to expand, but projects take years, so the response is slow and the price can overshoot in both directions, as the 1974 to 2001 fall shows. Look at the copper price page for the monthly series.
Concentration risk. With 23.0% of mining in Chile and 62.5% of ore imports in China, a disruption at either end, from a strike, a drought that limits water for concentrators, or a change in trade policy, travels through the whole market. The concentration report ranks copper against other commodities.
Substitution. When copper is dear, users can switch to aluminum for some uses, and you can compare them on the aluminum and tin pages. Whether this is happening now is not something the monthly price data can show.
The short version
- Copper reached a cash record of $14,326 a tonne in August 2026, up 48.1% in a year.
- Five countries mine 62.2% of it, led by Chile at 23.0%.
- China buys 62.5% of the world’s copper ore by value, so mining and smelting are in different countries.
- Adjusted for inflation, copper is still 32% below its April 1974 peak.
- The price has followed oil more closely at some times than others, most closely in 2006 to 2015.
Prices are monthly averages of benchmark quotes and lag the market. Nothing here is investment advice. The video above is from a third party and is shown for background only.
Commodities in this post
Prices are monthly benchmark averages that lag the market; informational only, not investment advice.