Coffee: who grows it, who buys it, and why it costs so much
Coffee is grown in 78 countries and drunk in nearly all of them, yet a single country grows almost a third of it. In 2024 the world produced 11.1 million tonnes of green coffee beans, and Brazil alone grew 3.39 million tonnes of that, or 30.4% (FAOSTAT). That concentration, plus a tree that takes years to replace, explains most of what has happened to the price since 2020. This article walks through the numbers: who grows it, who buys it, what the price has done, and why the record price of 2025 is less extraordinary than the headlines suggested.
Five countries grow more than two thirds
The five largest producers together grew 68.5% of the world’s beans in 2024. Brazil is first at 30.4%, followed by Vietnam at 18.1%, Colombia at 7.5%, Indonesia at 7.3% and Ethiopia at 5.2%. Uganda comes next at 3.6%. The gap between first and second place is wide: Brazil grows about two thirds more than Vietnam.
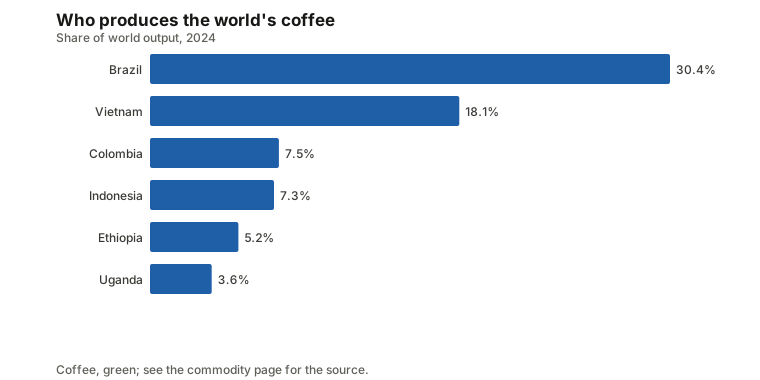
The two main species split the map. Arabica, the higher-priced bean, is grown at altitude in Brazil, Colombia and Ethiopia, while robusta, which tolerates heat and is cheaper, dominates in Vietnam and Indonesia. The World Bank’s benchmark, which this site tracks, is the arabica price quoted in New York, so it follows the Brazilian and Colombian crops more closely than the Vietnamese one. The coffee page shows the full ranking for every year, and the Brazil, Vietnam and Colombia pages show what else each country supplies.
A useful side effect of that geography is that the world is almost never between harvests. Brazil picks from May to September, Vietnam from October to January and Colombia from October to December (USDA crop calendars, on the harvest calendar). A poor Brazilian season therefore matters most in the months before Vietnam’s harvest arrives, when stores are thinnest.
The seller and the buyers are not the same countries
Coffee is a classic case where the biggest producers and the biggest consumers barely overlap. Green, unroasted coffee was traded across borders to a value of $33.7 billion in 2024 (CEPII BACI). Brazil sold $11.7 billion of it, about 35% of the world total, Vietnam $3.9 billion, Colombia $3.4 billion and Indonesia $1.6 billion.
On the buying side the United States imported $6.2 billion of green coffee, Germany $4.4 billion, Italy $2.6 billion and Belgium $2.5 billion. None of those four grows meaningful quantities. Their role is to roast and, in the case of Germany, Italy and Belgium, to re-export the roasted and soluble product, which is why the raw-bean ranking is the one that says where coffee comes from. The net trade report shows the same pattern across all 109 traded commodities: for coffee, 35 countries are net exporters and 71 are net importers.
What the price has done
The arabica benchmark averaged $3.53 a kilogram in 2015 and $3.32 in 2020. By 2024 it averaged $5.62, and in 2025 it averaged $8.47. The highest monthly average in the series, which starts in 1960, was $9.05 in February 2025. In August 2026 it stood at $7.97, which is 1.4% below a year earlier but 67.1% above five years ago and 224.0% above twenty years ago (World Bank Pink Sheet).
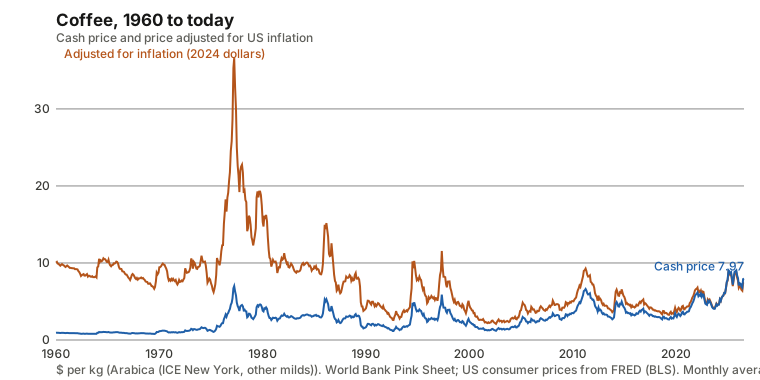
The chart shows why the record needs a qualifier. Prices in different decades are not comparable until you adjust for inflation (see nominal versus real prices). Deflated by the US consumer price index to 2024 dollars, coffee was $36.60 a kilogram in April 1977. The August 2026 price of $7.97 is worth $7.48 in 2024 dollars, only 20% of that peak. From April 1977 to August 2002 the real price fell 94%, and it has never climbed back (see the drawdowns report). So the 2025 record is a record in cash terms, in a series that began at $0.94 in 1960, but coffee remains far cheaper in real terms than it was fifty years ago.
Volatility has not changed much. The annualised standard deviation of monthly changes was 20.5% in the 2010s and 22.2% in the 2020s so far. The recent rise was one large, sustained move, not a jump in month-to-month noise.
Why supply could not respond quickly
Three features of coffee explain the run-up from $3.32 to $8.47 in five years.
Trees are slow. A coffee tree must be planted and grown before it bears a crop, so when the price rises, farmers cannot add output within a season. The world’s output is mostly the same trees as the year before plus whatever weather does to them. Over the ten years to 2024, world output grew 25.4%, and the split is instructive: harvested area grew 19.3% and yield only 5.1% (FAOSTAT, three-year averages; see land or yield). Coffee has grown mainly by planting more land, which is the slow route.
Stocks are thin. USDA estimates world ending stocks at 17.0 million 60-kilogram bags for the 2026 marketing year, against domestic consumption of 137.2 million bags, so stocks cover only about a month and a half of consumption in the producing and consuming countries combined. In the 2024 marketing year, stocks were lower, at 13.8 million bags. With a buffer that small, a bad harvest has nowhere to be absorbed except in the price. The stocks-to-use guide explains the mechanism, and a similar squeeze in another crop is the story of the 2024 cocoa spike.
One country decides the crop. With Brazil at 30.4% of output and a biennial bearing cycle in some of its trees, the size of its crop is the largest single variable in the market. USDA’s projection for the 2026 marketing year is 189.7 million bags of world production, up from 176.8 million in 2024, and a larger crop would be consistent with the easing from the February 2025 peak, although this site cannot show that it is the cause. A projection is not a result, however, and the price will track how the harvest actually turns out.
What does not move it
Coffee is often lumped with other commodities as one basket, but its price has little to do with the energy market. Its correlation with crude oil’s monthly changes was −0.08 in 1996 to 2005, 0.25 in 2006 to 2015 and −0.08 over the last ten years, which is close to nothing (World Bank Pink Sheet; a correlation of changes, not a cause; see which prices follow oil). What does move it is the supply side described above, and its price swings (20.5% annualised in the 2010s) are wider than copper’s (15.9%).
It also pays to be wary of the data itself. In 2024, 79.7% of world coffee output came from official national statistics, 5.2% from international sources, and about 15% was either estimated or imputed by FAO because a country did not report. The share is not unusual, and the data reliability report shows how coffee compares with the other 66 commodities.
Why the shelf price lags
Your café pays for far more than beans, and roasters typically buy months ahead, so the price of a cup follows the price of the bean slowly and only partly, in both directions. That means the 2025 peak has probably already worked through to most menus, while the easing of the wholesale price since then may take longer to appear. This is a general feature of processed food, not a measured figure from this site’s data, and the site does not track retail prices.
The short version
- Coffee is grown in 78 countries, but five grew 68.5% of it in 2024, and Brazil alone grew 30.4%.
- It is sold mainly by Brazil, Vietnam and Colombia and bought mainly by the United States and Europe, with roasters re-exporting some of it.
- The arabica price peaked at a cash record of $9.05 a kilogram in February 2025 and was $7.97 in August 2026.
- Adjusted for inflation, coffee costs about a fifth of what it did in 1977.
- Slow-growing trees and thin stocks mean supply cannot answer a price rise quickly, so the price is set mostly by harvest weather.
Prices are monthly averages of benchmark quotes and lag the market. Nothing here is investment advice. To explore further, start with the coffee commodity page and the arabica price history.
Commodities in this post
Prices are monthly benchmark averages that lag the market; informational only, not investment advice.