Chile: the country that mines the world's copper
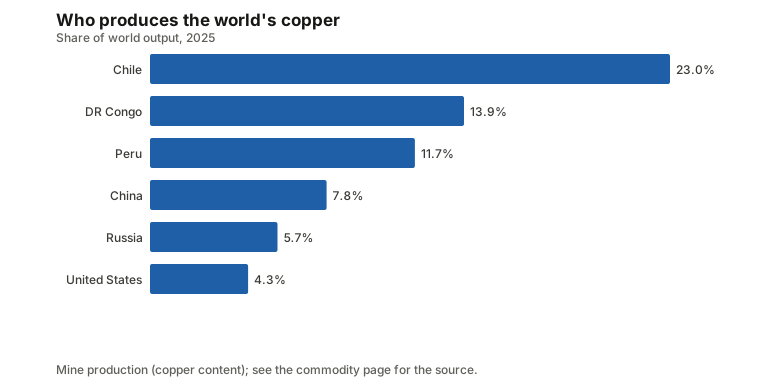
Chile is a narrow strip of land between the Andes and the Pacific, and it is, by a wide margin, the country that mines the world’s copper. In 2025 it produced 5.3 million tonnes of mined copper, 23.0% of the world total (USGS Mineral Commodity Summaries). But Chile is not a one-commodity economy in the way that fact alone can suggest. It is also the world’s largest exporter of lithium by value, a top-three producer of molybdenum, and a significant seller of salmon, grapes, hazelnuts and fishmeal. This article works through what Chile actually mines, grows and sells, using only the numbers behind this site’s Chile country page, and it is broader than a story about one metal.
Copper first, and by a wide margin
Chile’s 23.0% share of world mined copper in 2025 makes it the largest single source of the metal, ahead of the Democratic Republic of the Congo, Peru, China, Russia and the United States (USGS Mineral Commodity Summaries). The country’s other big metals are molybdenum, where it ranks second in mine output with a 16.15% world share (42,000 tonnes, 2025), and lithium, where it ranks third with 19.31% (56,000 tonnes, 2025). All three appear on the copper, molybdenum and lithium commodity pages, with the full producer ranking by year.
The copper record post already covers the copper price and China’s role as the main buyer of the ore, so this article does not repeat that ground. What it adds is the rest of the picture: what else Chile digs, grows and catches, and how that adds up in its own trade.
Copper is also most of what Chile sells abroad
Chile sold $31.0 billion of copper in 2024, 29.28% of the world’s copper export value (CEPII BACI) — a larger share of world exports than its 23.0% share of world mine output. Across every commodity this site tracks for Chile, copper made up $31.0 billion of a combined $45.0 billion in tracked exports in 2024, or 68.96% of that total. That figure is Chile’s export dependency score: the share of its largest tracked export in its own tracked-export basket, not a share of Chile’s true total exports, which include services and manufactured goods well beyond the 117 commodities this site follows. With that caveat, 68.96% concentrated in one commodity is still high, the kind of figure the concentration and concentration-over-time reports track across countries and years.
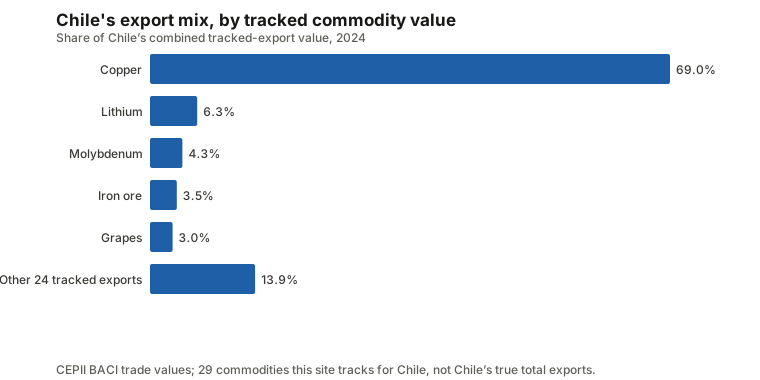
Behind copper, Chile’s next-largest tracked exports in 2024 were lithium at $2.81 billion (6.26% of the tracked total), molybdenum at $1.93 billion (4.30%), iron ore at $1.59 billion (3.55%) and grapes at $1.35 billion (3.00%). Chile is a net exporter in 29 of the commodities this site covers and a net importer in 28, with net exports across those commodities totaling $44.4 billion in 2024, led by copper’s $30.9 billion net surplus. The net trade report puts that split in a wider frame.
See the ore come out of the ground
The video above, from the documentary channel Spark, looks at Chuquicamata, one of Chile’s largest open-pit mines, in the Atacama Desert in the country’s north. It is a third-party production shown for background on the scale of the operation, not this site’s data, and it covers the mine, not the market.
Lithium and molybdenum: smaller volumes, outsized trade shares
Lithium shows the production-versus-export gap even more starkly than copper. Chile mined 19.31% of the world’s lithium in 2025, third place, yet supplied 73.28% of the world’s lithium exports by value in 2024, almost three quarters of the global total. Molybdenum shows the same shape: a 16.15% share of world mine output in 2025, second place, against a 23.69% share of world export value in 2024, first place. The producing, exporting and processing guide explains the general reason a mining share and an export share can diverge like this; this site’s trade data cannot say exactly how much of Chile’s lithium or molybdenum is processed domestically before sale.
Molybdenum also appears on the other side of Chile’s ledger: it imported $817.3 million of molybdenum in 2024, 10.02% of world imports, even while being the largest exporter by value. The fact sheet does not explain why both figures are large at once, only that they are; net, Chile still sold $1.12 billion more molybdenum than it bought. On reserves, USGS put Chile’s share of world lithium reserves at 24.86% in 2025, above its 19.31% share of production, and calculated that those reserves would cover about 128 years at 2025’s extraction rate — a ratio of two current numbers, not a forecast, since both can change. The reserves report explains how to read years-of-supply figures like this one.
What else Chile grows and catches
Chile ranked eighth in the world for grape production in 2024, a 3.23% share (FAOSTAT), but second for grape exports by value, at $1.35 billion and a 10.27% world share. Hazelnuts follow a similar shape: fifth in world production at a 6.05% share (73,274 tonnes in 2024) and second in export value at $238.3 million, a 10.41% share. Chile’s hazelnut output grew from 11,500 tonnes in 2014 to 73,274 tonnes in 2024 (FAOSTAT), and on this site’s land-and-yield breakdown for the crop, about four-fifths of that area’s growth in output came from planting more land rather than higher yields per hectare.
The sea contributes too. Chile ranked sixth in world fishmeal production in 2024, a 4.78% share (272,815 tonnes, FAO fisheries data), and third in fishmeal export value at $493.5 million, a 5.25% share, for a net fishmeal surplus of $321.9 million. Salmon is Chile’s third-largest seafood export by value in this site’s ranking, at $1.16 billion and a 7.27% world export share in 2024, though it does not appear among the commodities where Chile ranks in the world’s top ten producers in this site’s production data. Apples ($650.8 million, 8.06% world export share) and avocados ($324.6 million, 3.45%) round out a fruit export list that makes Chile one of the more diversified agricultural exporters among the world’s mining economies.
What Chile buys, and how concentrated it really is
Chile’s largest tracked net imports in 2024 were crude oil, a net $4.72 billion, natural gas, a net $2.16 billion, and coal, a net $694.9 million, with corn next at a net $493.4 million — a country that mines and exports metal but still buys much of the fuel and some of the grain it uses. Set against $44.4 billion in net exports across the commodities Chile sells more of than it buys, that import bill is modest, a reminder that a large net exporter overall can still depend on imports for specific goods, exactly the pattern the net trade report above tracks for every country.
Stepping back, Chile’s economy in this site’s data is a country with one dominant tracked export, copper, at 68.96% of its combined tracked-export value, and a long tail of 29 tracked commodities in total, several of which matter more to Chile’s trading partners than their small share of its own export basket would suggest. That dominance is a fact about Chile’s tracked-commodity exports specifically, and says nothing about services, wine sold as a branded product rather than a bulk grape, or manufactured goods outside the 117 commodities this site follows. Chile does not appear as the single largest producer of any commodity in the country-leaders report, a reminder that even in copper, its largest position by far, it leads by share rather than by near-monopoly.
The short version
- Chile mined 23.0% of the world’s copper in 2025, more than any other country (USGS Mineral Commodity Summaries).
- Copper was 68.96% of Chile’s combined tracked-export value of $45.0 billion in 2024, a concentration figure specific to the 117 commodities this site tracks, not Chile’s true total exports.
- Chile mines less of the world’s lithium (19.31%) than it exports by value (73.28%), and less molybdenum by mine share (16.15%) than by export share (23.69%).
- Beyond metals, Chile is a top-ten world producer and top-three exporter of grapes and hazelnuts, and a substantial seller of salmon and fishmeal.
- Chile’s largest tracked net imports are crude oil, natural gas and coal, worth far less than its $44.4 billion in net commodity exports.
Prices are monthly averages of benchmark quotes and lag the market. Nothing here is investment advice. The video above is from a third party and is shown for background only.
Commodities in this post
Prices are monthly benchmark averages that lag the market; informational only, not investment advice.