Australia: what it digs out of the ground and grows
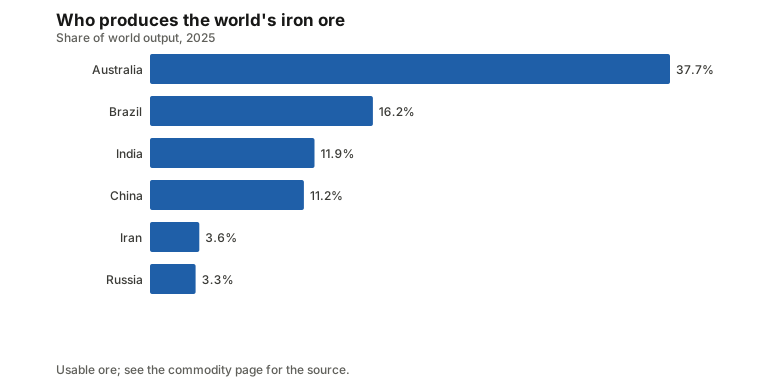
Australia is a mid-sized economy that punches far above its weight in raw materials. In 2025 it mined 37.7% of the world’s iron ore, more than the next two producers combined, and it is also the world’s largest producer of lithium, at 31.7% of world output (USGS Mineral Commodity Summaries). It sells wool, lamb, coal, barley and chickpeas to the rest of the world in larger shares than any other country. This article works through what Australia actually digs up and grows, how concentrated each market is, and how one commodity in particular dominates its export earnings.
Iron ore: mined by five, sold mostly by one
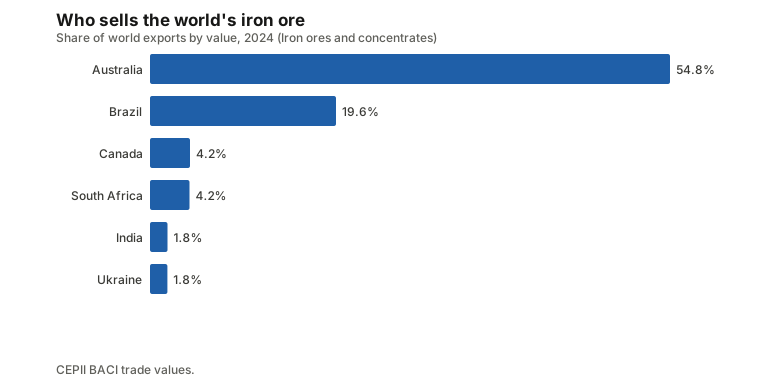
The world mined about 37.7% of its iron ore in Australia in 2025, with Brazil a distant second at 16.2%, India at 11.9% and China at 11.2% (USGS MCS). On the trade side the gap widens further: Australia sold 54.8% of the world’s iron ore exports by value in 2024, against Brazil’s 19.6%, with Canada and South Africa each around 4% (CEPII BACI). Reserves suggest the position is not about to change soon. Australia holds 28.9% of known iron ore reserves, and at the current rate of extraction, USGS figures imply about 76 years of mining ahead of it, well above the years left for gold, lead or zinc reserves discussed below.
That gap between mining and reserves points to the underlying geology: the Pilbara region of Western Australia holds enormous, easily accessible iron ore bodies, and the iron ore commodity page tracks how that has translated into output and price every year. This is also a case where the country that mines the ore is the country that sells it, unlike the pattern in copper, where a small group of miners ships ore to a single dominant buyer; see the producer-versus-exporter report for that distinction across all tracked commodities.
To see what the ore looks like coming out of the ground, BHP’s own history of its Pilbara operations is a useful, if promotional, primer:
What else comes out of the ground
Iron ore is the largest line, but Australia ranks in the world’s top 10 for output of a long list of other minerals (USGS MCS, 2025 unless noted). It is the largest lithium producer, at 31.7% of world output, among only nine countries that reported any mined lithium that year. It is the second-largest producer of bauxite, at 22.1%, second in lead at 10.7%, third in gold at 8.5%, third in zinc at 8.5%, fourth in manganese at 8.0%, and eighth in both copper (3.2%) and nickel (1.2%). On reserves, Australia holds 35.8% of known lead reserves against 10.7% of current output, and 34.1% of known manganese reserves against 8.0% of output, both wider gaps between reserves and production than iron ore’s, implying more years of mining ahead relative to the current pace: 21 years for lead and 85 for manganese, versus 18 for zinc and 20 for gold.
Energy commodities round out the minerals side. Australia produced 4.8% of the world’s coal in 2025 and 3.5% of its natural gas, measured in physical output (Energy Institute). Gas output has grown quickly: from 74 billion cubic metres in 2015 to 149 billion cubic metres in 2025, a 7.2% annual pace over the decade. None of these production shares are dominant the way iron ore and lithium are, but on the export side several of them are: Australia sold 34.5% of the world’s coal exports by value in 2024, the largest share of any country, and 10.3% of natural gas exports (BACI). The critical minerals guide covers why lithium in particular gets special attention as the energy transition changes demand for it.
The paddock side: wool, lamb and pulses
Australia’s farm exports are less concentrated in output than its minerals but often more concentrated in trade. It grew 16.6% of the world’s wool in 2024, second behind China, yet sold 62.4% of the world’s greasy and scoured wool exports by value the same year, by far the largest share of any country (FAOSTAT; BACI). The pattern repeats in meat: Australia is not the largest producer of sheep meat, but it supplied 42.2% of world sheep and goat meat exports by value in 2024. Grains and pulses show the same gap between growing and selling: Australia ranks second in world barley output (9.3%) but first in barley exports (19.3%, worth $1.77 billion), and second in chickpea output (13.4%) but first in chickpea exports (24.5%, worth $602 million).
Two of those crops also show very different routes to the same result. Chickpea output rose 87.6% over the decade to 2024, with harvested area up only 6.9% and yield per hectare up 75.4% over the same period, so area accounts for just 10.7% of the total growth (FAOSTAT, three-year averages). Lentil output rose far more sharply, 563.4%, with area up 417.9% and yield up 28.1%, so area accounts for 86.9% of that growth, the opposite pattern. Both ended up as major exports, but one grew mostly by farming existing land harder and the other by putting far more land under the crop; the land or yield report shows the same split for other countries and crops, and the chickpeas commodity page has the full production and trade series.
One commodity dominates the export numbers
This site tracks export value for 117 commodities worldwide, and for Australia 61 of them show up with any recorded export value, totalling $277.2 billion in 2024. Iron ore alone was $87.4 billion of that, or 31.5% of Australia’s combined tracked-export value. That is a share of the 117 commodities this site follows, not of Australia’s true total exports, which also include services, manufactured goods and other categories outside this site’s scope, so it should be read as a measure of concentration within tracked raw materials, not a complete trade balance.
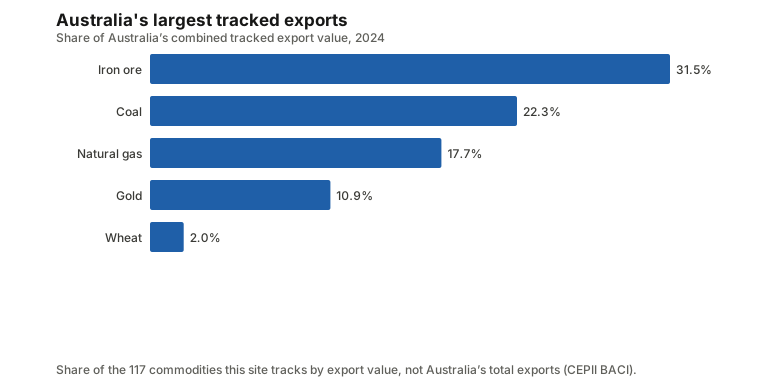
The concentration goes further than one commodity. The top five tracked exports, iron ore, coal, natural gas, gold and wheat, together made up 84.5% of Australia’s $277.2 billion in tracked export value, with wheat itself a modest 2.0% behind the other four. The export dependency report ranks every country by this measure, and the concentration over time report shows whether reliance on a top commodity has been rising or falling for a given exporter, though that longer trend is beyond what a single fact sheet can show for Australia here.
A net exporter almost everywhere, net importer of a few things
Of the commodities this site tracks trade for, Australia is a net exporter in 51 and a net importer in 20, and its combined net trade position across all of them is a surplus of $265.1 billion (BACI, 2024). The three largest net export lines are iron ore ($87.3 billion), coal ($61.7 billion) and natural gas ($48.8 billion), the same three commodities that dominate the export-dependency ranking above. On the import side, the largest net deficits are far smaller: urea at $1.4 billion, pork at $467 million and coffee at $456 million. A country that exports tens of billions of dollars of iron ore still buys its nitrogen fertiliser, some of its pork and essentially all of its coffee from elsewhere, which is a reminder that net exporter status in aggregate says nothing about self-sufficiency in any one good. The net trade report lays out the same exporter-versus-importer count for every country, and the concentration report shows how unusual Australia’s mix of a few huge export lines and many small import ones is by world standards. Its position as the world’s top producer of both iron ore and lithium also makes Australia one of a short list of countries that leads world output of more than one tracked commodity; the country leaders report ranks them all.
The short version
- Australia produced 37.7% of the world’s iron ore in 2025 and sold 54.8% of world iron ore exports by value in 2024.
- It is also the world’s largest lithium producer, at 31.7% of output among just nine producing countries.
- It is the largest exporter by value of wool (62.4%), sheep meat (42.2%), coal (34.5%), barley (19.3%) and chickpeas (24.5%).
- Iron ore alone is 31.5% of Australia’s $277.2 billion in tracked export value, and the top five tracked exports make up 84.5% of it.
- Australia is a net exporter in 51 of the tracked commodities and a net importer in 20, including urea, pork and coffee.
Figures are the latest available from FAOSTAT, USGS Mineral Commodity Summaries, CEPII BACI and the Energy Institute, each with its own reference year as noted above. Nothing here is investment advice. The video above is from a third party and is shown for background only. To explore further, start with the Australia country page and the iron ore price history.
Commodities in this post
Prices are monthly benchmark averages that lag the market; informational only, not investment advice.