What are critical minerals? A plain-English guide
A critical mineral is a raw material that a government has judged essential to its economy or security and vulnerable to a supply disruption. That is a statement about risk, not about rarity or price. A mineral can be abundant in the ground and still be critical because almost all of it is mined, or more often processed, in a handful of places, and little can stand in for it. Two official lists matter most to readers of this site: the United States’ 2025 list of 60 minerals and the European Union’s Critical Raw Materials Act, which names 34 critical raw materials, 17 of them also designated strategic. Forty commodities on this site appear on at least one of them (the critical minerals hub lists every one).
Critical does not mean rare
The word invites the wrong picture, of a few exotic metals running out. The lists are built to measure vulnerability: how much a modern economy depends on a material, and how easily a disruption could be absorbed. The US Geological Survey says it built its 2025 list with updated methods for assessing how a supply disruption could affect the US economy and national security. The 2025 update added ten minerals to the 50 already on the 2022 list, and several of them are neither rare nor exotic: copper, silver, lead, potash and phosphate (US Geological Survey, final 2025 List of Critical Minerals, Federal Register notice 2025-19813). Barite, a cheap, heavy mineral used mostly to weight oil-well drilling fluid, is on both lists. Being listed tells you a government sees supply risk, and nothing about geological scarcity; the glossary entry puts the distinction in two paragraphs.
Two lists, built for different purposes
The US list is an assessment published by a science agency, revised in 2022 and again in November 2025, when it grew from 50 to 60 minerals. The EU’s is part of a law, Regulation (EU) 2024/1252, in force since 23 May 2024. The Act does more than list: it sets benchmarks for 2030, that at least 10% of the EU’s annual consumption should come from EU extraction, 40% from EU processing and 25% from recycling, and that no more than 65% should come from a single third country (European Commission). Its strategic list singles out the materials most needed for green, digital, defence and aerospace technologies. The Commission’s own page notes that copper and nickel “do not meet the CRM thresholds” for criticality but are on the list as strategic raw materials, a reminder that these lists reflect policy as well as measurement.
They overlap heavily but not completely. Twenty-six of the 40 commodities here are on both. Of the other fourteen, eleven are on the US list only (chromium, indium, lead, potash, rhenium, silver, tellurium, tin, uranium, zinc and zirconium) and three, feldspar, helium and strontium, are on the EU list only. The EU names several things the US does not, such as helium, feldspar and phosphorus. Other governments keep their own lists, and a mineral can be critical in one country and routine in another.
Mining is concentrated, but unevenly
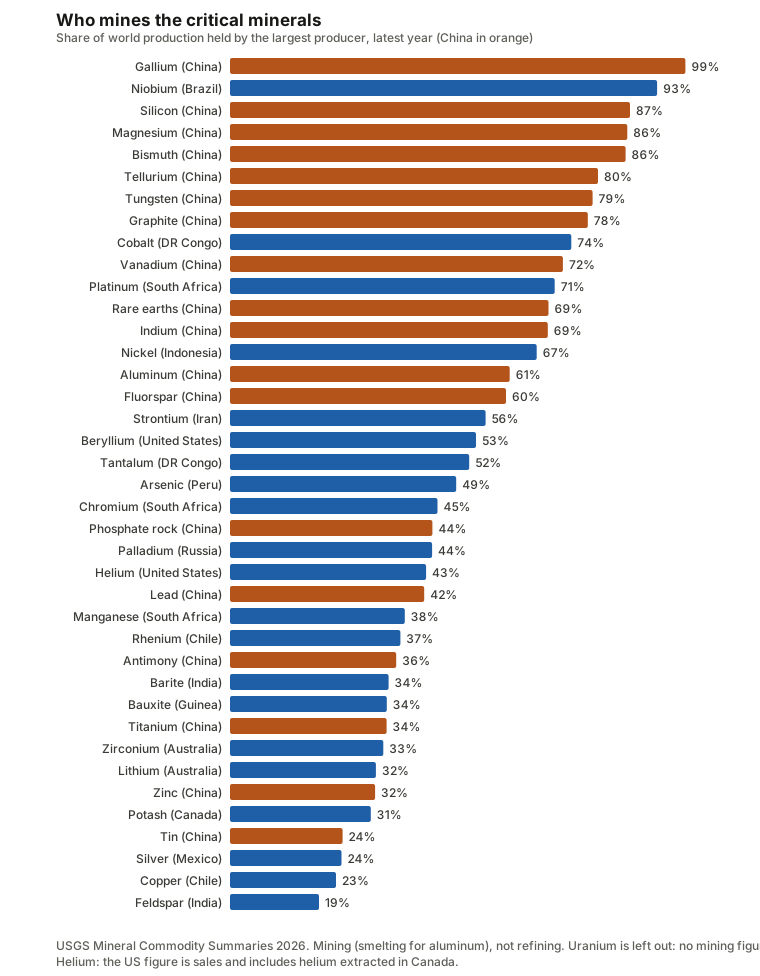
For the 39 of those commodities with a production figure on this site (uranium’s production series here is nuclear generation, so it is left out), a single country produces half or more of the world’s supply of 19: gallium (China, 99%, low-purity primary output), niobium (Brazil, 93%), silicon (China, 87%, silicon metal), magnesium (China, 86%), bismuth (China, 86%, refinery output), tellurium (China, 80%, refinery output), tungsten (China, 79%), graphite (China, 78%), cobalt (DR Congo, 74%), vanadium (China, 72%), platinum (South Africa, 71%), rare earths (China, 69%), indium (China, 69%, refinery output), nickel (Indonesia, 67%), aluminum (China, 61%), fluorspar (China, 60%), strontium (Iran, 56%), beryllium (United States, 53%) and tantalum (DR Congo, 52%) (USGS Mineral Commodity Summaries 2026). For most of these the figure is mine output; for aluminum, bismuth, gallium, indium, silicon and tellurium it is smelter, refinery or low-purity primary output, which is what USGS reports. China is the largest producer of 18 of the 39. The median largest producer holds 49% of world output, against 31% for the median of the other 72 commodities on the site that have production data, and the share of commodities with a 50% producer is 49% against 19%.
The spread is wide, though. Copper’s largest producer, Chile, mines 23% of the world’s, silver’s, Mexico, 24%, tin’s, China, 24%, and feldspar’s, India, 19%. Critical minerals are, on average, more concentrated than other commodities, not uniformly so.
The narrow step is often processing
Mining concentration is the part of the picture that is easiest to measure, and often not the narrowest. Copper is the clearest case: China mined about 8% of the world’s copper in 2025 but produced about 48% of the refined metal, with the gap filled by imported ore, concentrate and scrap (USGS, as set out in critical minerals and the energy transition).
The trade data on this site shows the same pattern by customs line, which is a measure of what crosses borders, not of capacity. For antimony, China mines 36% of the world’s, and in 2024 it was 50% of exports of antimony oxide by value, while the largest exporter of antimony ore was Thailand at 29% (CEPII BACI). For tungsten, the largest exporter of ore was Bolivia at 15%, and China was 61% of exports of unwrought tungsten. For titanium, the largest ore exporter was South Africa at 23%, and China 41% of exports of titanium dioxide pigment. The ore leaves one set of countries and the processed product comes from another. Where the processing step is narrower than the mine, a disruption there matters more than reserves or mine output would suggest, which is the point of the glossary entry and of producing, exporting and processing.
Critical does not mean expensive, or exchange-traded
Twenty-five of the 40 commodities have no free public price series: the World Bank Pink Sheet and the IMF publish no benchmark for niobium, magnesium, tungsten, graphite, vanadium, rare earths, fluorspar, chromium, antimony, titanium, barite, bauxite, beryllium, bismuth, silicon, zirconium, feldspar, gallium, indium, rhenium, tantalum, tellurium, arsenic, helium or strontium. Their prices are set in private contracts and assessed by price reporting agencies, so a reader cannot simply look one up. That gap is part of what makes these markets hard to follow, and it is why the pages on this site explain how each is priced instead of quoting a number it cannot source.
What the data cannot tell you
- A list is not a forecast of shortage. Nothing here says any mineral is running out. USGS reserves are an economic definition, and for several of these minerals, such as vanadium, tungsten and fluorspar, they are many times a year’s production.
- The data is thin in places. USGS’s table for vanadium names only four producing countries and niobium’s names six, which says more about what is reported than about geology. USGS publishes only two years of production by country, so trends are not shown.
- Mining is not refining. Mine output is measured here; processing capacity mostly is not, so the trade lines above are the nearest proxy.
- Lists change. The US list grew by a fifth in 2025. These were read on 6 October 2026, and each commodity’s status is taken from USGS’s own flag in its Mineral Commodity Summaries data and from the Act’s annexes, not typed by hand.
Where to go next
The critical minerals hub shows every listed commodity side by side, with who mines it, who holds the reserves and which list names it. Cobalt and lithium have their own posts: DR Congo and cobalt and lithium, boom and bust. Newer pages cover antimony, tungsten, vanadium, niobium, fluorspar, titanium, magnesium, barite, zirconium, beryllium, bismuth, silicon, feldspar, gallium, indium, rhenium, tantalum, tellurium, arsenic, helium and strontium. Figures are from USGS, the Energy Institute, CEPII BACI and the lists’ own texts; none of this is investment advice.
Commodities in this post
Prices are monthly benchmark averages that lag the market; informational only, not investment advice.