Lithium: 2022 boom, 2025 bust, and who mines it
Lithium is one of the few commodities where the price has gone through a full boom and bust inside the short period we can measure, and where the country that mines the most is not the country that sells the most. The IMF’s benchmark for lithium metal averaged $148,620 a tonne in August 2026 (IMF Primary Commodity Prices), 82.2% above a year earlier but only 30.3% of the April 2022 record of $490,008. This article sets out who mines lithium, who exports and imports it in each of its main traded forms, and what the price history does and does not show.
Nine countries mine it, and three mine 72%
In 2025 the world mined an estimated 290,000 tonnes of lithium, measured as lithium content (USGS Mineral Commodity Summaries). That world total excludes United States output, which USGS withholds to avoid disclosing company data, so every share below is a share of the reported total, not of everything mined. Only 9 countries reported production.
Australia leads with 92,000 tonnes, 31.7% of the total. China follows with 62,000 tonnes (21.4%), Chile with 56,000 (19.3%), Zimbabwe with 28,000 (9.7%) and Argentina with 23,000 (7.9%). The top five together account for 90.0%, and Australia, China and Chile alone for 72.4%.
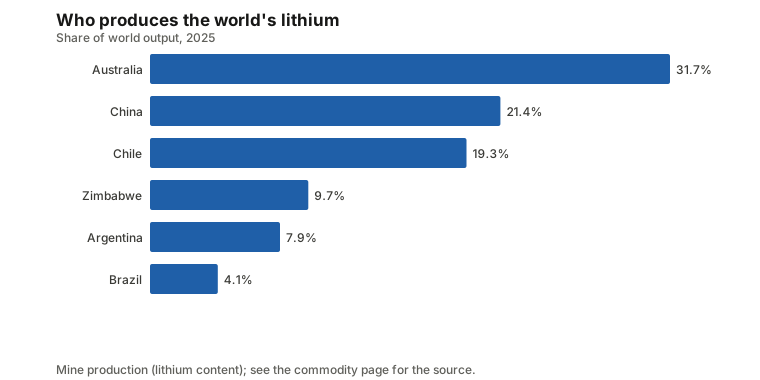
Nature explains part of this. As general background, lithium comes from two kinds of deposit: hard rock, where the mineral spodumene is mined and concentrated, and salt-lake brine, where lithium-bearing water is pumped out and evaporated. Australia is a hard-rock producer, and Chile and Argentina are brine producers. The concentration report ranks lithium’s mining concentration against other commodities, and the lithium commodity page lists every producer by year. The Australia, China and Chile pages show what else each sells.
Reserves add one more number. Chile holds 24.9% of the world’s estimated reserves, against 19.3% of mine output. At 2025 mining rates the known reserves would last about 128 years (USGS). The reserves report treats that as a snapshot, not a forecast, because reserves are re-estimated as prices change and new deposits are found.
The price: a spike, a slide and a rebound
The IMF series for lithium metal, 99% battery grade, starts in June 2012, so it covers a little over fourteen years. Everything below is a comparison within that window and says nothing about earlier decades.
For the first years the price was flat: about $64,000 in 2012 and $65,258 in 2015, with a series low of $62,377 in February 2015. The annual average was $75,011 in 2020 and $111,234 in 2021, then $416,958 in 2022, with the monthly record of $490,008 in April 2022. The 2023 average was $266,931, 2024 was $113,585 and 2025 was $85,305. That is 79.5% below the 2022 average.
The low of the last 24 months was $77,075 in June 2025. The price then rose: $95,257 in December 2025, $131,471 in January 2026 (up 38.0% in a month) and $174,127 in May 2026, 125.9% above the June 2025 low. It has eased since, to $156,809 in July and $148,620 in August, a 5.2% drop in the latest month.
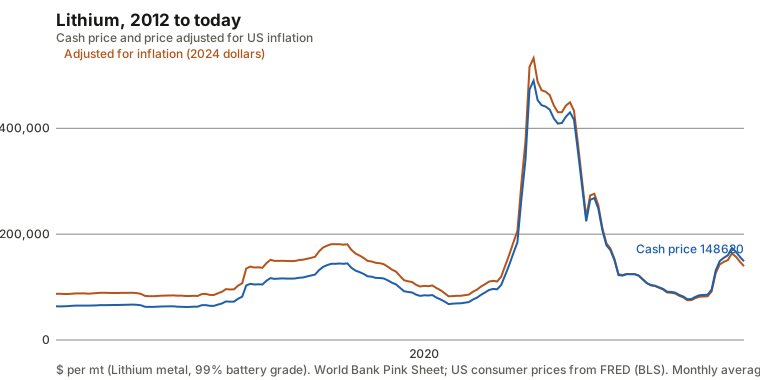
The rebound has put the 2026 average so far, $155,287 for January to August, above every full year in the series except 2022 and 2023. Why prices moved is not something a price series can answer. The site does not track battery demand, mine costs or inventories, so this article makes no claim about the causes. The general guide to why commodity prices spike covers the usual mechanisms, and commodity supercycles covers the longer waves.
Adjusted for inflation, the record is further away
A cash price is what was paid in the month. An inflation-adjusted price restates it in constant dollars so different years can be compared. Deflated by US consumer prices to 2024 dollars, the April 2022 peak was $532,694 a tonne, and August 2026 is worth $139,532 in 2024 dollars. That is 26.2% of the real peak, or 73.8% below it. The inflation line on the chart is drawn from 2012 only, because that is where the lithium series begins. See nominal versus real prices for how the adjustment works, and the drawdowns report for how lithium’s fall compares with other markets.
Mined in Australia, sold from Chile
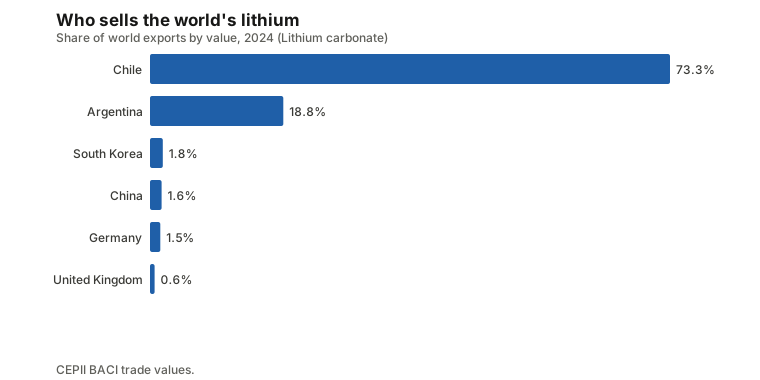
The ranking of miners is not the ranking of exporters. The main traded form in this site’s data is lithium carbonate, and in 2024 the world exported $3.84 billion of it (CEPII BACI, HS 283691). Chile sold $2.81 billion, 73.3% of the total, and Argentina $721 million, 18.8%. Together they supplied 92.1%. South Korea, China and Germany each supplied under 2%. Australia, the largest miner, is outside the top 15 carbonate exporters.
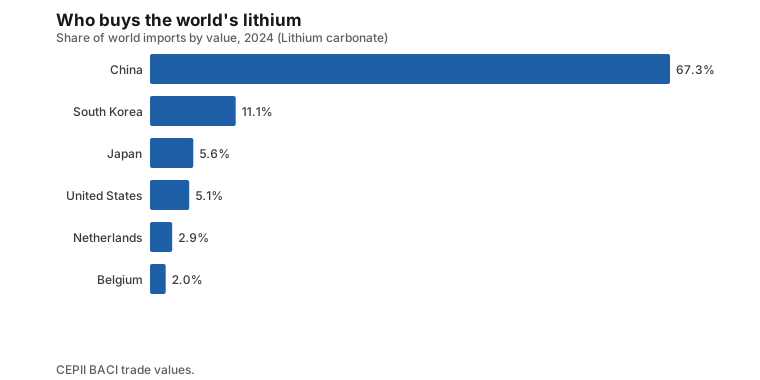
The buying side is also concentrated. China imported $2.58 billion of carbonate, 67.3% of the world’s imports by value. South Korea took $426 million (11.1%), Japan $215 million (5.6%) and the United States $195 million (5.1%). After subtracting exports, China’s net imports were $2.52 billion, while Chile’s and Argentina’s net exports were $2.81 billion and $721 million (the net trade report).
Ore, chemicals and metal are different trades
Carbonate is one point in a chain. The other forms tell a different story, and the guide to HS codes explains why each is counted separately. The site’s data notes that Australia mines spodumene concentrate and ships it to China, which refines most of the world’s battery-grade chemicals, while Chile exports finished carbonate directly. The trade figures are consistent with that.
For the broad customs heading that includes spodumene (mineral substances not elsewhere specified, CEPII BACI, 2024), world exports were $6.29 billion. Australia sold $3.18 billion, 50.6%, and Zimbabwe $837 million, 13.3%. China imported $4.53 billion, 72.0%. This heading is a catch-all, so it also contains minerals other than lithium ores, and its values should be read as an upper bound for spodumene.
For lithium oxide and hydroxide, another battery chemical, the world traded $2.69 billion in 2024. Here China is the seller: $2.00 billion, 74.4%, ahead of Chile at 10.1% and the United States at 6.6%. The buyers are South Korea, $1.60 billion or 59.6%, and Japan, $660 million or 24.6%, together 84.2%.
Read together, the three tables show three different roles: Australia and Zimbabwe sell ore, Chile and Argentina sell carbonate, and China sells hydroxide while buying most of the ore and carbonate. That is the gap between mining, exporting and processing described in producing versus exporting versus processing. The critical minerals guide makes the same point for other metals.
Watch how it is mined
The DW News channel has a report on the salt-flat lithium reserves of South America, which is useful background on where brine lithium comes from. It is third-party content about the region and the process, not this site’s data:
What this data cannot tell you
Three limits are worth stating. First, the price history is short: 171 monthly observations, so “record” means the highest since June 2012 and nothing more. Second, the production and trade figures are annual, for 2025 and 2024, and the price is monthly through August 2026, so they describe different periods. Third, the shares depend on data quality: USGS leaves out the United States, and trade values come from customs reports that can differ between exporter and importer (see data reliability).
The site also does not track electric vehicle sales, battery production or mine costs, so it cannot say whether the 2026 rebound reflects demand, supply cuts or something else. Related battery metals can be compared on the cobalt, nickel and graphite pages. The price is for lithium metal, while the trade tables above are mostly carbonate, so they are different products (see benchmarks explained). The monthly reports show how unusual each month’s move was. Sources and vintages are listed on the sources page.
The short version
- Lithium metal averaged $148,620 a tonne in August 2026, up 82.2% in a year but 69.7% below the April 2022 cash record of $490,008.
- The 2025 average of $85,305 was 79.5% below the 2022 average; the low of the past 24 months was $77,075 in June 2025.
- Adjusted for inflation (2024 dollars), the latest price is 26.2% of the April 2022 peak.
- Australia, China and Chile mine 72.4% of the reported world total; USGS excludes the United States.
- Chile and Argentina sell 92.1% of world carbonate exports, while China buys 67.3% of carbonate imports and sells 74.4% of hydroxide exports.
- The price series is short, starting June 2012, and the site cannot show what drove the swings.
Prices are monthly averages of benchmark quotes and lag the market. Nothing here is investment advice. The video above is from a third party and is shown for background only.
Commodities in this post
Prices are monthly benchmark averages that lag the market; informational only, not investment advice.