DR Congo: the world's cobalt supply, in one country
The Democratic Republic of the Congo mined 74.19% of the world’s cobalt in 2025, a share no other country comes close to for any major mineral (USGS Mineral Commodity Summaries). It also sold 64.64% of the world’s exports of unwrought cobalt and mattes by value in 2024, worth $3.05 billion (CEPII BACI). Those two numbers describe what the country is to the global economy: not a diversified exporter, but the source of a single metal the rest of the world cannot do without. This article sticks to what DR Congo’s fact sheet contains, which is short, rather than stretching it further than the numbers allow.
Three-quarters of the world’s cobalt comes from one country
World mine production of cobalt reached 310,000 tonnes of cobalt content in 2025, and DR Congo accounted for 230,000 tonnes of it, a 74.19% share (USGS Mineral Commodity Summaries). Indonesia is a distant second, and the top five producers together supplied 93% of the world’s cobalt that year. No other country produces enough to matter much if DR Congo’s output changes; the cobalt commodity page has the full ranking by year.
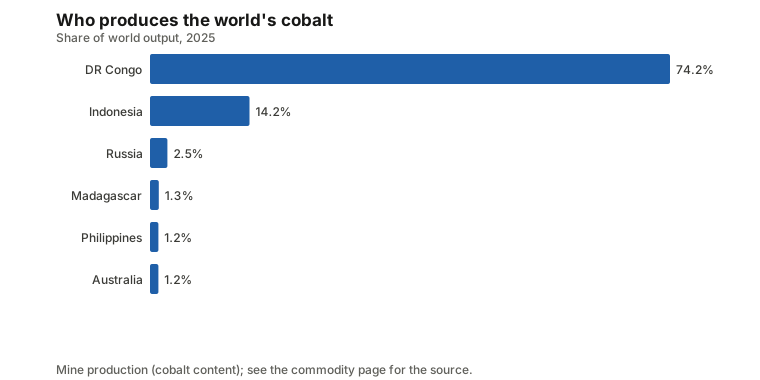
That concentration is unusual even among metals. Copper, cobalt’s sister metal, has its top producer at 23% of world output (the copper commodity page has the full ranking); cobalt’s top producer is more than three times that. Most of the world’s cobalt is, in practice, one country’s mining sector. The concentration report ranks every tracked commodity by how much of its output sits with the single largest producer, and cobalt sits near the top of that list.
Copper, tin, and the crops that stay home
Cobalt is not mined on its own: almost all of it comes out of the ground as a byproduct of copper mining. DR Congo is also the world’s second-largest copper miner, at 13.91% of world output in 2025, and the fifth-largest tin miner, at 9.31% (USGS Mineral Commodity Summaries, both 2025). The copper and tin commodity pages show how those rankings have moved over time.
The country’s largest agricultural crops tell a different story. DR Congo is the world’s second-largest grower of both cassava, at 13.63% of world output, and plantains, at 11.09% (FAOSTAT, 2024). Those are large shares of a global food staple, but neither shows up on the export ranking the way cobalt does, because cassava and plantains are grown mainly for domestic consumption. “Produces a lot of X” and “exports a lot of X” are different rankings, a distinction the guide to producing, exporting and processing covers in more detail.
Half the reserves, three-quarters of the mining
DR Congo holds an estimated 50% of the world’s known cobalt reserves, against its 74.19% share of 2025 mine output (USGS reserves statistic, 2025). Measured against DR Congo’s own production alone, those reserves imply roughly 39 more years of mining at the current rate. That is a simple reserves-to-production ratio, not a forecast: it does not account for new discoveries, demand changes, or output shifting to other countries as they develop their own deposits.
The gap between the reserve share (50%) and the production share (74%) means DR Congo is mining cobalt faster, relative to its share of known reserves, than the rest of the world is mining its share. Whether that gap closes because other countries ramp up, more reserves are found in DR Congo, or DR Congo’s output eventually slows is not something a single year of data can answer. The reserves report applies the same comparison across every tracked mineral.
One commodity, one buyer
DR Congo’s only commodity export that ranks among the world’s top ten sellers of anything is cobalt: $3.05 billion in 2024, 64.64% of the $4.72 billion in world exports of unwrought cobalt and mattes (CEPII BACI), and its largest tracked net export, with copper ore a near-equal net export of $3.03 billion. This site could not calculate what share of DR Congo’s own total tracked exports cobalt represents, so no dependency percentage is stated here. What can be said qualitatively is that cobalt is the one commodity in which DR Congo is a dominant, visible global supplier, and every other line in the country’s data is a far smaller share of its world market.
That distinction matters because a single dominant export can mean two different things. In some countries one commodity leads the export ranking because the country is a trading and refining hub re-exporting what it does not produce, the way Switzerland’s gold exports reflect refining rather than mining. DR Congo is closer to the opposite case: it is the actual mine producer of the cobalt it sells, so a swing in the cobalt price is a swing in the underlying resource, not a trading margin. The export dependency report and the net trade report put this alongside the 109 commodities the two reports track.
On the buying side, the pattern common to metal ores repeats: China took 68.47% of world imports of cobalt mattes and unwrought cobalt by value in 2024 (CEPII BACI), so most Congolese cobalt is refined outside the country that mines it.
What the price has done
Cobalt is priced more erratically than copper or coffee. The IMF’s benchmark cobalt price averaged $26,327 a tonne in 2024, the bottom of a multi-year slide from $63,765 in 2022. By August 2026 it had rebounded to $55,854 a tonne, up 69.8% from a year earlier and close to its 2018 average of $72,911 (IMF Primary Commodity Price System). The all-time high in the series, which begins in 1992, was $95,023 a tonne in March 2008; adjusted for US inflation, that peak is worth about $139,650 in 2024 dollars, well above anything seen since. Trade reports put spot cobalt below $38,500 a tonne in early October 2026, a fall of more than 30% in a month (PricePedia, 6 October 2026); the IMF series on this page runs to August.
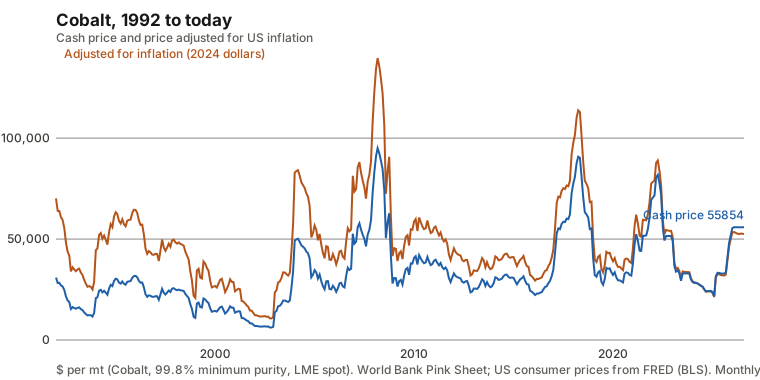
That volatility follows from the concentration described above: with three-quarters of supply from one country and no large buffer of alternative sources, small changes in DR Congo’s output, in battery demand, or in trade policy move the world price by tens of percent within a year or two. The cobalt price page has the full monthly series in both cash and inflation-adjusted terms, and the concentration report discusses why concentrated commodities tend to be volatile ones.
The conditions behind the numbers
None of the figures above touch on how cobalt is mined day to day. Alongside large industrial operations, a portion of DR Congo’s cobalt is extracted by artisanal and informal miners, and this informal sector has been the subject of extensive reporting on unsafe working conditions, child labor, and inadequate pay. These are well-documented, general concerns raised repeatedly by journalists, NGOs and international bodies. This site does not track a verified figure for what share of output comes from artisanal mining, so no percentage is given here, and the concerns below should be read as background from outside reporting, not as a claim measured by this site’s data.
The video below is one such piece of reporting, from a mainstream broadcaster, shown for background rather than as this site’s own analysis:
Cobalt’s role in lithium-ion batteries also means these mining conditions sit upstream of the broader shift toward electric vehicles and grid storage. The critical minerals and the energy transition guide covers how cobalt fits alongside lithium and nickel in that story, without this article extending the country’s production and trade numbers into claims about the energy transition itself that the fact sheet cannot support.
The short version
- DR Congo mined 74.19% of the world’s cobalt in 2025 and sold 64.64% of world cobalt exports by value in 2024, worth $3.05 billion (USGS, CEPII BACI).
- It is also the world’s second-largest copper miner (13.91% share) and fifth-largest tin miner (9.31% share), both 2025.
- DR Congo holds 50% of known cobalt reserves against a 74% share of current output, implying about 39 years of mining at that rate if nothing else changes.
- China buys 68.47% of world cobalt-matte imports by value, so most Congolese cobalt is refined outside the country that mines it.
- The cobalt price swung from $63,765 a tonne in 2022 to $26,327 in 2024 and back to $55,854 by August 2026, reflecting how little spare supply exists outside DR Congo.
- Reporting on artisanal cobalt mining raises serious, well-documented labor and safety concerns that this site’s trade and production data cannot itself quantify.
Prices and shares are the latest annual or monthly figures available from each source, cited above, and lag the market. Nothing here is investment advice. The video above is from a third party and is shown for background only.
Commodities in this post
Prices are monthly benchmark averages that lag the market; informational only, not investment advice.