Gold's record price: who mines it, who trades it
Gold is mined in many places, but it is traded and refined in a few, and its price has just been through the most extreme run in its records. The World Bank’s benchmark, the London PM fix, averaged $2,388 an ounce in 2024 and $3,442 in 2025, and reached a cash record of $5,020 in February 2026 (World Bank Pink Sheet). No country mines even an eighth of the world’s gold, yet the trade table is led by a country that mines almost none. This article covers who mines it, where the metal actually moves, what the price has done in cash and inflation-adjusted terms, and what this site can and cannot say about why.
No country mines an eighth of it
In 2025 the world mined 3,300 tonnes of gold (USGS Mineral Commodity Summaries). China mined 380 tonnes, or 11.5% of the total. Russia followed at 310 tonnes (9.4%), Australia at 280 (8.5%), Canada at 200 (6.1%) and the United States at 160 (4.8%). Together the top five mined 40.3%. Ghana mined 150 tonnes (4.5%), Mexico 140 (4.2%) and Kazakhstan 130 (3.9%).
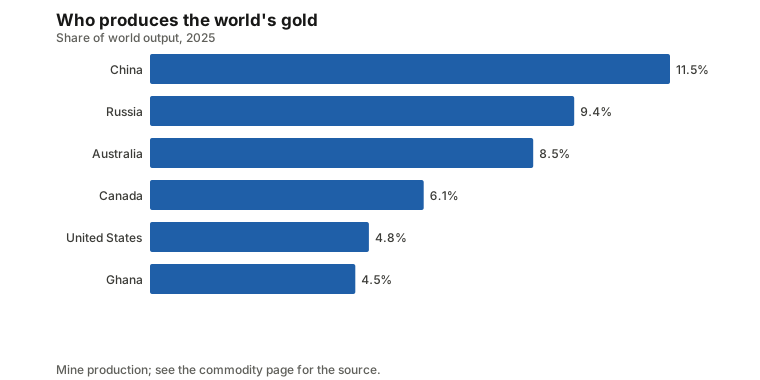
That is much less concentrated than copper, where the top five mine 62.2%. Gold is dug on every inhabited continent, and the concentration report shows where it sits among the 96 commodities this site tracks. The gold commodity page has the full ranking, and the China, Russia, Australia and Ghana pages show what else each country supplies.
The USGS also publishes reserve estimates, the gold that is known and economic to mine at current prices. Australia holds 19.7% of the world’s reserves, more than twice its 8.5% share of mining in 2025. At 2025 mining rates the world’s reserves would last about 20 years. That is a snapshot, not a forecast, because reserves are re-estimated as prices change and new deposits are found (see the reserves report).
Where the metal moves is a different map
Gold’s trade table looks nothing like its mine table. In 2024 the world exported $587.7 billion of unwrought and semi-manufactured gold, HS code 7108 (CEPII BACI). Switzerland exported $106.4 billion of it, 18.1% of the world total. The United Arab Emirates exported $57.9 billion (9.9%), Canada $52.4 billion (8.9%), Hong Kong $35.6 billion (6.1%), Australia $30.3 billion (5.2%) and South Africa $29.0 billion (4.9%).
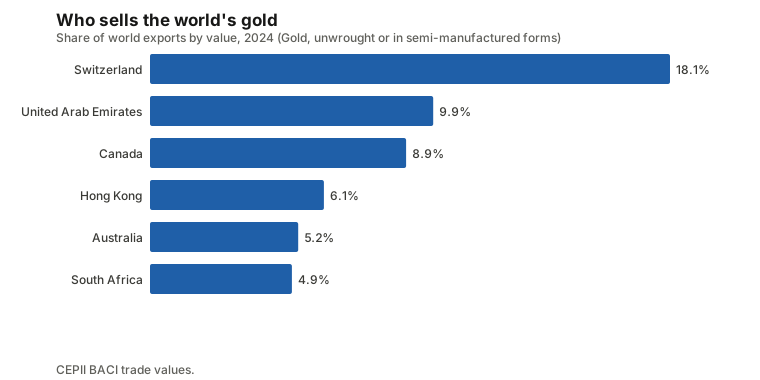
Switzerland, the UAE and Hong Kong do not appear among the miners in the table above. They appear here because they refine, vault and trade gold, and because this category includes bullion bars as well as raw and semi-finished metal. The mine table is the origin map, and the export table is a map of where the metal is handled. The guide to producing, exporting and processing explains why these differ.
The import side has the same problem. Switzerland also tops imports at $112.2 billion (19.1%), followed by the United Kingdom at $83.1 billion (14.1%), Hong Kong at $63.2 billion (10.8%), China at $62.9 billion (10.7%), India at $58.5 billion (10.0%) and the UAE at $32.1 billion (5.5%).
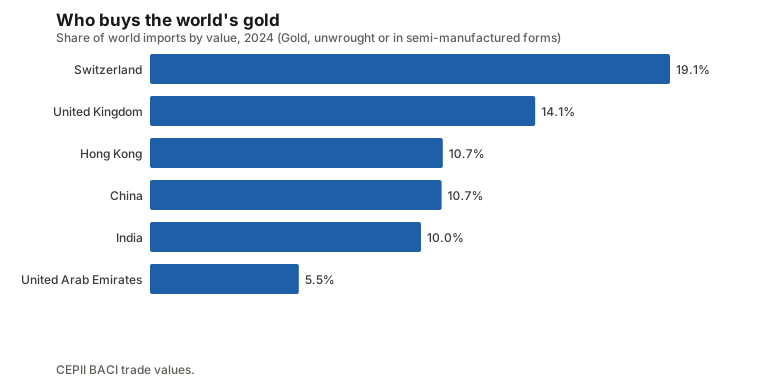
The same hubs sit near the top of both tables, so gross trade overstates how much gold any country ends up keeping. The net trade report nets exports against imports for 2024. The largest net exporters were Canada (+$42.7 billion), the UAE (+$25.8 billion), South Africa (+$25.0 billion), Australia (+$23.8 billion) and Japan (+$19.7 billion). The largest net importers were the United Kingdom (−$68.0 billion), India (−$58.5 billion), China (−$49.3 billion), Hong Kong (−$27.6 billion) and Turkey (−$15.2 billion). Switzerland is in neither list, consistent with its role as a place gold passes through. The Switzerland and India pages show the wider trade picture for each.
The data here cannot say why any country imports gold. Whether it is for jewellery, bars and coins, or reserves held by a central bank is general background that this site does not measure: it does not track central-bank holdings or investment demand.
How the metal is made
Mining is only the first step. The video below is from Newmont, one of the world’s largest gold miners, so it is a company’s own account and describes the process and how it has changed. It is third-party, shows background on making gold, and does not use this site’s data.
What the price has done
Gold was $35 an ounce in January 1960, the first month of the series. Its annual averages were $445 in 2005, $1,225 in 2010, $1,161 in 2015 and $1,770 in 2020. They rose to $1,801 in 2022, $1,943 in 2023, $2,388 in 2024 and $3,442 in 2025. The 2025 average is 44.1% above 2024 and 94.4% above 2020. In August 2026 the price was $4,411, which is 31.0% above a year earlier, 147.1% above five years ago and about seven times its level twenty years ago (World Bank Pink Sheet).
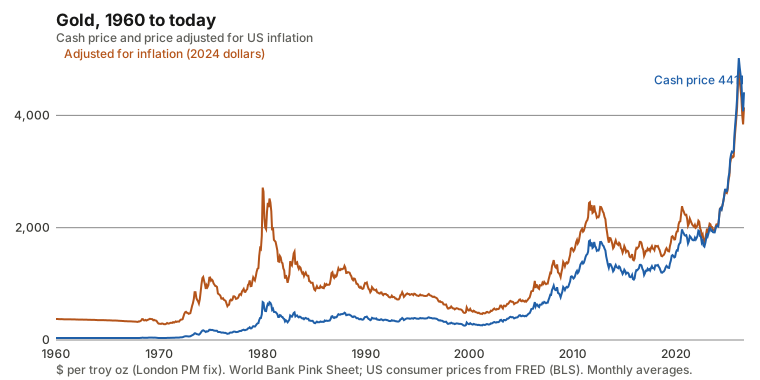
The August price is 12.1% below the February peak in cash terms. Deflated by the US consumer price index to 2024 dollars, the February 2026 price was $4,809, and August’s $4,411 is worth $4,141, which is 86.1% of that peak. Unlike copper and coffee, gold’s inflation-adjusted high is recent: the real peak and the cash record fall in the same month (see nominal versus real prices).
That was not always so. The drawdowns report shows that in inflation-adjusted terms gold lost 83.0% from January 1980 to April 2001, a fall that took 255 months. It then took another 286 months, to February 2025, to get back above the 1980 level. The real prices report compares this with other commodities, and the guide to why commodity prices spike covers the general mechanics. The recent run also belongs to the wider 2025 metals rally.
What the data does not explain
The price is a single benchmark, the London PM fix, so it does not show what caused the rise. Gold’s general role is as a store of value that people and institutions hold, alongside its use in jewellery and electronics. That is background knowledge, not a finding here. The site has no data on central-bank purchases, fund holdings or jewellery demand, so it cannot attribute the 2025 and 2026 rise to any of them.
What the data can show is how gold behaves relative to other things. Its correlation with crude oil’s monthly changes was 0.07 in 1996 to 2005, 0.26 in 2006 to 2015 and −0.04 over the last ten years (World Bank Pink Sheet; a correlation of monthly changes, not a cause). That is close to zero in the most recent decade, so gold has not moved with energy prices (see which prices follow oil). Its closest partners are other precious metals: the correlation of monthly changes with silver was 0.72 over 120 months, and with platinum 0.51. Again these are correlations, not causes.
Gold’s price swings are moderate. The annualised standard deviation of monthly changes was 11.6% in the 2010s and 13.0% in the 2020s so far, below coffee’s 20.5% in the 2010s. The spot versus futures guide explains how the benchmark used here differs from a futures quote such as COMEX gold, and the sources page lists the datasets and vintages behind every number.
Reading the trade data carefully
Refining hubs show large flows that are re-exports, and a single year’s dollar value moves with the price. The data reliability report shows how different commodities compare on the quality of their production statistics. The mine figures are USGS estimates, so small gaps should not be over-read: China’s 11.5% against Russia’s 9.4% is 70 tonnes on 3,300.
The short version
- The world mined 3,300 tonnes of gold in 2025, and the top five countries, led by China at 11.5%, mined 40.3%.
- Switzerland is first in both exports (18.1%) and imports (19.1%) in 2024 because it refines and handles gold, not because it mines it.
- Gold set a cash record of $5,020 an ounce in February 2026 and was $4,411 in August, 12.1% lower.
- In 2024 dollars gold is at 86.1% of its February 2026 peak, and its real high is recent, unlike copper’s or coffee’s.
- The site has no data on central banks or investment demand, so it cannot say why the price rose; its correlation with oil is close to zero and with silver is 0.72.
Prices are monthly averages of benchmark quotes and lag the market. Nothing here is investment advice. The video above is from a third party and is shown for background only. To go further, see the gold price history, the monthly changes and the guide on who trades commodities.
Commodities in this post
Prices are monthly benchmark averages that lag the market; informational only, not investment advice.