Commodity roundup, July 2026: the biggest movers
This roundup was written on 2026-09-20, after the fact, from the published series for July 2026. Of 42 benchmark series, 13 rose on the month and 28 fell, and 1 was unchanged; the median change was −1.0%. Cocoa rose most (+27.5% to $5.61/kg) and silver fell most (−11.8% to $58.8/troy oz).
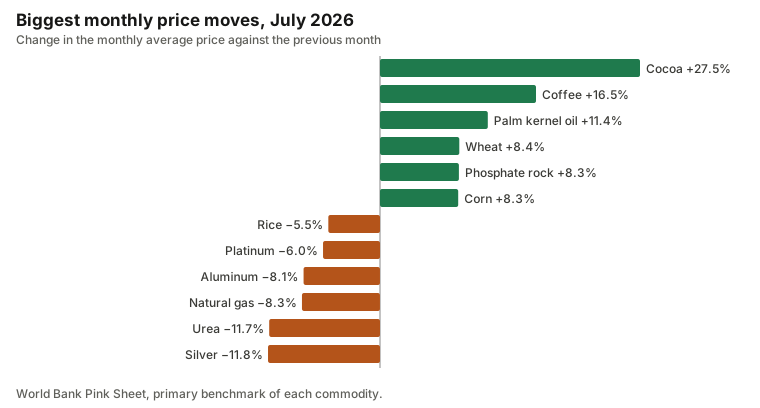
The largest gains
- Cocoa (Cocoa (ICE New York and London average)): $5.61/kg, +27.5% on the month, −24% on the year. This is the largest one-month rise since December 2024, and the 4th rise in a row.
- Coffee (Arabica (ICE New York, other milds)): $7.91/kg, +16.5% on the month, +10% on the year. This is the largest one-month rise since March 2014.
- Palm kernel oil (Malaysia, CIF Rotterdam): $2,413/t, +11.4% on the month, +15% on the year. This is the largest one-month rise since March 2026.
- Wheat (US hard red winter, Gulf export): $310/t, +8.4% on the month, +32% on the year. This is the largest one-month rise since September 2022.
- Phosphate rock (Morocco, 70% BPL, FOB Casablanca): $170/t, +8.3% on the month, +11% on the year. This is the largest one-month rise since July 2022.
- Corn (US No. 2 yellow, Gulf export): $213.4/t, +8.3% on the month, +11% on the year. This is the largest one-month rise since September 2024.
The largest falls
- Silver (Handy & Harman, New York): $58.8/troy oz, −11.8% on the month, +56% on the year. This is the largest one-month fall since June 2026.
- Urea (Urea, FOB Middle East): $400/t, −11.7% on the month, −19% on the year. This is the largest one-month fall since June 2026, and the 3rd fall in a row.
- Natural gas (US Henry Hub): $2.89/MMBtu, −8.3% on the month, −9% on the year. This is the largest one-month fall since April 2026.
- Aluminum (LME cash, high grade): $3,161/t, −8.1% on the month, +21% on the year. This is the largest one-month fall since April 2025.
- Platinum (London afternoon fix): $1,622/troy oz, −6.0% on the month, +17% on the year. This is the largest one-month fall since June 2026, and the 6th fall in a row.
- Rice (Thai 5% broken, Bangkok FOB): $467/t, −5.5% on the month, +19% on the year. This is the largest one-month fall since March 2026.
Each mover’s page lists what drives its price and where it comes from, which is the place to look for the reasons behind a move; this roundup reports what changed, and does not guess at why.
Records, runs and the longer view
No series set a new highest monthly average in cash terms this month.
Long runs in one direction: Platinum has fallen for 6 months in a row; Gold has fallen for 5 months in a row; Lamb has risen for 5 months in a row; Cocoa has risen for 4 months in a row; Oranges has fallen for 4 months in a row.
Over twelve months, the largest changes were Tin +58%; Silver +56%; Oranges −49%; Copper +39%; Coconut oil −32%.
By category
By category, softs had the highest average change (+12.6%) and energy the lowest (−5.1%). Every category: Softs +12.6% (4 series); Grains & cereals +3.7% (3 series); Oilseeds & vegetable oils +1.2% (7 series); Timber & forest products −0.6% (3 series); Fibres & other raw materials −0.9% (2 series); Livestock, meat & dairy −0.9% (3 series); Fertilizers −1.3% (4 series); Fruit & vegetables −2.9% (2 series); Metals −4.1% (10 series); Energy −5.1% (3 series).
Method
A change compares a monthly average price with the previous month’s. “Largest since” looks back through the whole series, and a record is a new highest monthly average in cash terms. A series that did not report in the month is left out, not filled. Prices are monthly averages of benchmark quotes and lag the market, and nothing here is investment advice. The full table for the month is on the July 2026 report, and every month is in the monthly archive and as JSON. Sources and data vintages are on the sources page.
Commodities in this post
Prices are monthly benchmark averages that lag the market; informational only, not investment advice.